
Struggling to predict your startup’s future sales? You’re not alone. Many founders build incredible products but stumble when investors ask for the numbers.
This guide gives you a clear plan to build a revenue forecast that VCs take seriously.
A revenue forecast is a projection of your company’s future sales. Think of it as your financial roadmap. It’s a logical story about your business potential, backed by data and clear assumptions.
It’s the language investors speak.
A solid forecast helps you answer tough questions:
- How many engineers can we afford to hire?
- What should our Q3 marketing budget be to hit our targets?
- Are we on track to hit our annual goals?
Without one, you’re flying blind.
Why a revenue forecast is a founder’s most important tool
Think of your forecast as your startup’s financial GPS. It isn’t just about predicting the future. It’s about building it.
Internally, a forecast guides every major decision. It turns abstract goals like "hit our first million" into a concrete, actionable plan. It gets your whole team pulling in the same direction.
Speak an investor’s language
For investors, a forecast is even more critical. It’s how they measure your understanding of the market and your ability to execute a plan.
VCs aren’t expecting a perfect crystal ball. They want to see the logic behind your numbers. A credible forecast shows a defensible path to scale.
It answers their most fundamental questions:
- How big can this get? Your forecast shows the market opportunity and your strategy to capture it.
- Do you know how to get there? It details the actions and investments needed to hit revenue milestones.
- Are your assumptions realistic? A forecast grounded in data builds trust.
Essentially, your forecast is your financial story. A sloppy one can kill a deal before it starts. Getting it right is a key step in your fundraising journey.
Example: Treat an industry growth forecast as one external assumption, then translate it into your own customer volume, pricing, and sales-capacity assumptions. That link between market context and operating reality is what makes a forecast credible.
Choose your forecasting method
The method you choose depends on your startup’s stage and data quality. Picking the right approach impacts how credible your numbers look to an investor.
There are two primary approaches. Each tells a different story about your business.
The top-down approach
A top-down forecast starts with the big picture. You begin with the Total Addressable Market (TAM), then estimate the slice you can realistically capture.
It’s a great way to show your vision, especially early on.
The basic flow:
- Identify your TAM: Start with the total market size for your product.
- Segment your market: Narrow it to your Serviceable Addressable Market (SAM) and then Serviceable Obtainable Market (SOM).
- Estimate market share: Project the percentage of the SOM you can win over time.
This method answers, "How big is the pond we’re swimming in?"
Example: The global market for your software is $10 billion (TAM). Your initial target segment is $1 billion (SAM). You project capturing 1% of that in year one, for a $10 million forecast.
The bottom-up approach
A bottom-up forecast starts with your operational realities. It builds a projection from what you can actually do. This method is more credible because it’s rooted in execution.
It forces you to answer specific questions:
- How many sales reps can we hire this quarter?
- What’s our website’s conversion rate and monthly ad spend?
- What is our pricing, and how many units can our team produce?
You can learn more about related metrics in our guide on how to calculate run rate.
Example: You have five sales reps. Each can close $200k in new business per year. Your bottom-up forecast for that channel is $1 million.
The hybrid model
The most compelling forecasts use a hybrid approach.
Build a detailed bottom-up model from your operational plan. Then, check it against a top-down analysis. This ensures your ambitions are realistic within the larger market.
This gives you the best of both worlds: a grounded, execution-focused plan validated by a massive market opportunity.
Quick comparison table
| Attribute | Top-down approach | Bottom-up approach |
|---|---|---|
| Starting point | Total market size (TAM) | Your company’s internal capacity |
| Best for | Early-stage, pre-revenue startups | Post-revenue, operational startups |
| Investor view | Shows vision and market potential | Shows execution ability and credibility |
| Primary risk | Can feel aspirational or unrealistic | May underestimate market potential |
| Key question | "How big could this get?" | "What can we realistically achieve?" |
Gather the right inputs
Your forecast is only as strong as your assumptions. This is where your model tells a real, defensible story.
Investors will poke holes in your assumptions. Your job is to ground every one in market research, early data, or industry benchmarks.
Document your core assumptions
Be transparent and document where each number comes from.
Here are the inputs you must have ready:
- Total Addressable Market (TAM): What’s the biggest revenue opportunity? Pull this from credible sources like Gartner or Forrester.
- Pricing model: How much will customers pay? Document your pricing tiers and the logic behind them.
- Sales funnel conversion rates: What percentage of leads become customers? Use your data or find industry benchmarks.
- Customer Acquisition Cost (CAC): How much does it cost to get one new customer?
- Customer Lifetime Value (LTV): How much revenue will one customer bring in over their lifetime?
Each assumption feeds into the next, creating a logical chain. This is also where you’ll need other key metrics, so learn how to calculate gross margin.
Example: A B2B SaaS founder might start with these inputs:
- TAM: $5 billion global market for project management software (Source: Gartner report).
- Pricing: $20/user/month, based on competitor analysis.
- CAC: $250 per new customer, based on a pilot LinkedIn ad campaign.
- Conversion rate: 2% from visitor to trial, and 15% from trial to paid.
- LTV: $1,440, based on an average 36-month customer lifespan.
Build a forecast for your pitch deck
Investors don’t want your 100-tab spreadsheet. They want a clear, concise summary that tells a powerful growth story. A simple visual is your best friend.
Set the right time horizon
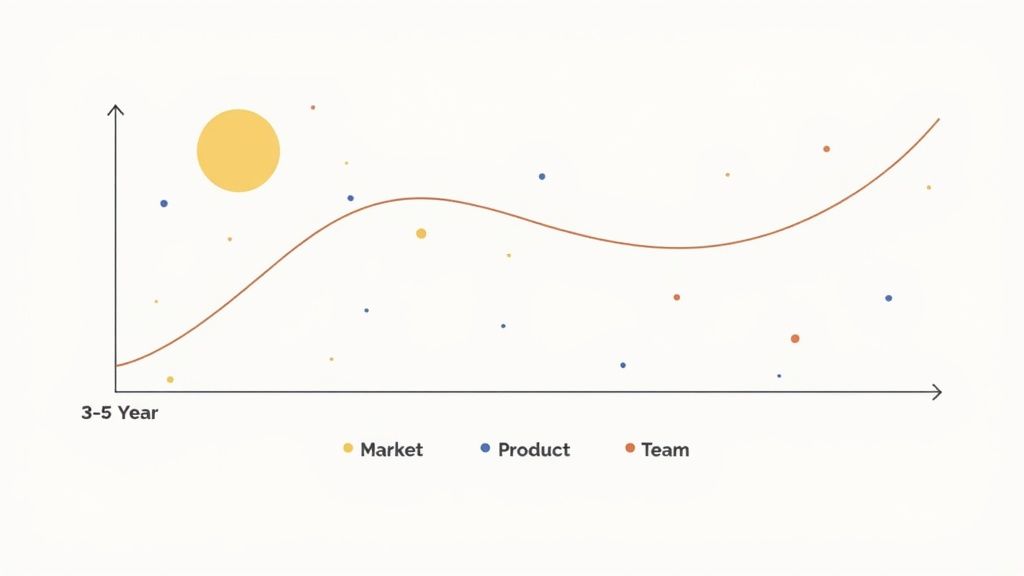
A three- to five-year forecast is the industry standard. This gives investors enough runway to see how you plan to scale.
Your level of detail should get broader over time.
- Year 1: Break it down monthly. This shows your grip on immediate operations.
- Years 2-3: Switch to a quarterly view.
- Years 4-5: An annual summary is all you need.
This structure proves you can balance tactical execution with a long-term vision.
Tell a story with your numbers
Your forecast slide must do more than show a chart going up and to the right. It needs to connect your financial projections to your core growth drivers.
For a deeper dive, use our startup financial projections template.
Example: Here’s a simple framework for your pitch deck forecast. It connects your financial goals to your operational plan. (All figures are for illustration).
| Metric | Year 1 | Year 2 | Year 3 |
|---|---|---|---|
| Revenue | $750K | $3M | $12M |
| Customers | 500 | 2,000 | 8,000 |
| Avg. revenue/customer | $1,500 | $1,500 | $1,500 |
| Key growth driver | Direct sales team launch | US market expansion | New enterprise product |
This format is clean, digestible, and gives investors the narrative they need.
Avoid common forecasting mistakes
A bad forecast can kill a deal fast. Investors spot lazy assumptions from a mile away. Getting it wrong signals you don’t know your business.
The unexplained "hockey stick"
This is the most infamous mistake. It’s a chart showing flat growth, then an explosive, vertical jump in revenue.
Growth doesn’t just happen. It’s the result of specific actions: hiring reps, ramping up ad spend, or entering new markets. If your forecast shows a massive spike in revenue, your model must show the investment that drives it.
Forgetting the costs of growth
Another red flag is a forecast where revenue scales but acquisition costs stay flat. You can’t triple your sales without a serious bump in your Customer Acquisition Cost (CAC).
Your forecast must show a logical link between revenue goals and expenses.
- Sales costs: More revenue means more salespeople and support staff.
- Marketing spend: Your ad budget must scale with your revenue targets.
If revenue grows 300% while costs only grow 50%, investors will tear your model apart.
Ignoring customer churn
Forgetting about churn is a rookie mistake, especially for SaaS businesses. No company retains 100% of its customers.
A credible forecast models churn and its impact on your customer base. It proves you’re thinking about the entire customer lifecycle. Check out modern data-driven forecasting trends to get up to speed.
Presenting base, best, and worst-case scenarios also shows strategic thinking.
Example: A forecast shows revenue tripling in Year 3. The slide should also show a corresponding 75% increase in sales & marketing headcount and a 200% increase in ad spend in late Year 2 to make that growth credible.
Ready to build a forecast that gets investors excited? We combine VC experience with data-driven design to create pitch decks that turn attention into term sheets. Let’s build your story.
