
Struggling to project your startup’s future revenue? You need a quick, forward-looking snapshot of where you’re heading.
Calculating your run rate is simple. Take one month’s revenue and multiply it by 12. Or use a recent quarter’s revenue and multiply it by 4. This guide shows you how to do it right.
What is the basic run rate formula?
Founders need a fast way to project future revenue. The run rate calculation provides exactly that. It’s a key metric for high-growth companies, especially in SaaS.
It offers an immediate glimpse into potential annual performance. You avoid getting bogged down in a complex financial model.
The idea is simple. You extrapolate what you recently earned over a full year. This assumes your current revenue stream will hold steady.
The core calculation
The formula is direct. You only need two things to start:
- A recent revenue figure (e.g., last month’s).
- The right multiplier to annualize that period.
Let’s say your startup pulled in $100,000 last month. Your annual run rate is $1.2 million ($100,000 x 12). If you brought in $250,000 last quarter, your run rate is $1 million ($250,000 x 4).
Quick-reference table
This table shows how to project revenue across a full year.
| Revenue period | Calculation (revenue x multiplier) | Example ($10,000 revenue) |
|---|---|---|
| Daily | Revenue x 365 | $10,000 x 365 = $3,650,000 |
| Weekly | Revenue x 52 | $10,000 x 52 = $520,000 |
| Monthly | Revenue x 12 | $10,000 x 12 = $120,000 |
| Quarterly | Revenue x 4 | $10,000 x 4 = $40,000 |
Example
Imagine a B2B SaaS company generated $30,000 in Monthly Recurring Revenue (MRR).
To get an annual projection, the founder multiplies this by 12.
- $30,000 MRR x 12 months = $360,000 annual run rate
A single month can be an outlier. A quarterly view is often more stable.
Let’s say the company’s total revenue for the last quarter was $80,000.
- $80,000 quarterly revenue x 4 quarters = $320,000 annual run rate
The quarterly figure provides a smoother, more realistic projection. It averages out the highs and lows.
Where a simple run rate calculation fails
Relying on a basic run rate is a rookie mistake. It can lead to flawed projections and tough board conversations.
A simple calculation assumes the last month will repeat for a year. That almost never happens. A run rate is a snapshot, not a crystal ball.
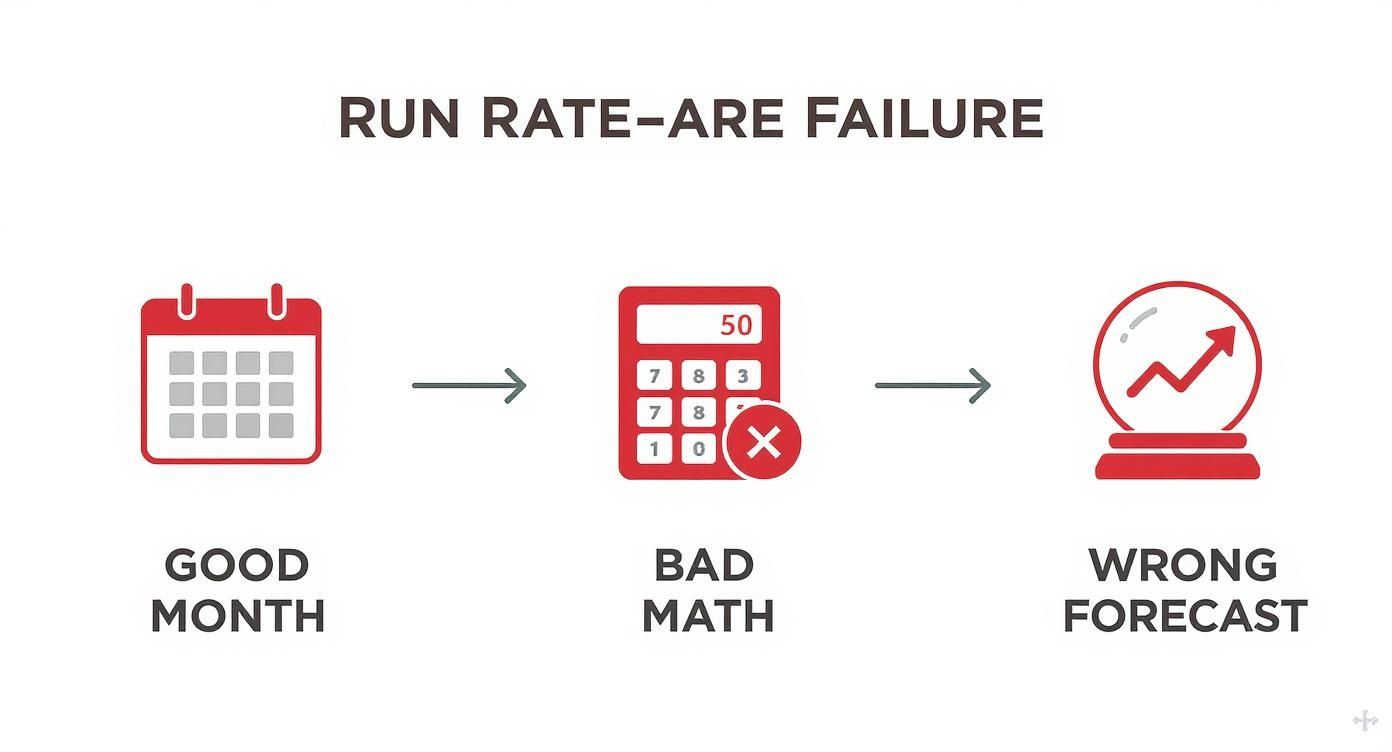
One great month can create a dangerously optimistic forecast. One slow month can cause unnecessary panic.
The impact of seasonality
Many businesses have predictable peaks and valleys.
An e-commerce platform might pull in 40% of its annual sales in Q4. A B2C fitness app could see a huge spike in January.
Calculating your run rate on a peak quarter is a strategic liability. It messes with hiring, spending, and investor trust. For a full financial picture, you also need to know how to calculate burn rate.
Example
A retail tech company hits $400,000 in revenue in Q4.
A simple calculation projects a $1.6 million annual run rate ($400k x 4). But the business is highly seasonal. The actual full-year revenue might only be $1.1 million.
One-time revenue events
Not all revenue is equal. A simple run rate often fails to distinguish between recurring and non-recurring income.
Common one-time revenue events include:
- Large setup or implementation fees.
- A single, large consulting project.
- A bulk license purchase that won’t happen again.
Example
A SaaS startup has $50,000 in monthly revenue.
But $20,000 came from a one-off setup fee. Its true recurring revenue is only $30,000. The simple run rate is $600,000. A more realistic projection is $360,000. That’s a $240,000 difference.
Fluctuating sales cycles
Early-stage sales cycles are rarely consistent. A single large deal closing a day late can shift revenue from one month to the next.
This skews the entire projection. A startup with $20,000 in monthly sales in January might show a $240,000 annual run rate. But if sales dip to $15,000 in March, the story changes.
First Round Review has great insights on run rate variance.
How to build an adjusted run rate
A simple run rate is a blunt instrument. You need to refine it to make it a valuable planning tool.
An adjusted run rate accounts for seasonality and one-off events. This turns a vanity metric into a diagnostic tool.
Let’s break down the two most critical adjustments.
Smooth for seasonality
Most businesses have a natural rhythm. Using a single peak month to project the year is a recipe for disaster.
Instead, use a trailing three-month average. This approach smooths out monthly bumps and gives you a more stable baseline.
Example
A B2C subscription box generates $150,000 in December. The basic run rate is $1.8 million.
But October revenue was $80,000 and November was $90,000. The three-month average is $106,667 ([$80k + $90k + $150k] / 3). The adjusted run rate is $1.28 million – a far more defensible figure.
Normalize for one-off revenue
Your run rate should reflect predictable, repeatable income.
Identify and strip out non-recurring revenue before you annualize the number. This is crucial for showing your core business momentum. It’s also a key part of learning how to build a financial model that VCs trust.
An investor will always ask, "How much of this is repeatable?" Give them the answer before they ask.
Example
A startup’s monthly revenue is $60,000. This gives them a basic run rate of $720,000.
But $15,000 came from a one-time implementation fee. Your true recurring revenue for the month was $45,000. Your adjusted run rate is $540,000 ($45k x 12).
How to choose the right time period
The time period you choose shapes the story your numbers tell. Get it wrong, and you can look wildly optimistic or too conservative.
Match the period to your business model and revenue volatility.
Most early-stage SaaS companies live and die by the month. A monthly run rate is a practical place to start. For most founders, the debate is monthly vs. quarterly.
Monthly run rate: This is your operational pulse-check. It’s perfect for internal tracking because it’s responsive. But it’s prone to swings.
Quarterly run rate: This is the investor-preferred metric. It smooths out monthly ups and downs. This gives a more stable and defensible projection.
As Drivetrain.ai notes, longer periods almost always provide a more stable figure.
Framework for choosing a period
Use this quick framework to decide which period makes sense.
| Factor | Choose monthly if... | Choose quarterly if... |
|---|---|---|
| Audience | It’s for your internal team and operations. | You’re reporting to your board or investors. |
| Business Stage | You’re very early-stage and tracking rapid growth. | You have several quarters of data and want stability. |
| Sales Cycle | Your sales are transactional and fairly consistent. | You land lumpy, enterprise deals that close irregularly. |
| Goal | You need a quick snapshot of current momentum. | You need a conservative, defensible projection. |
The best practice is often to calculate both. Use the monthly figure to motivate your team. Use the quarterly figure to manage investor expectations.
How to present the run rate to investors
Calculating your run rate is one part of the equation. Knowing how to frame it for investors is the real work.
VCs want the story behind the number. They need confidence that you understand every nuance.
Tossing a single run rate figure on a slide is a red flag. It tells investors you either don’t grasp your revenue or you’re hiding something.
Build the narrative
Lead with an adjusted run rate. This shows you’re a sophisticated founder.
Present a few different calculations side-by-side. This gives investors context and lets you control the story.
- Basic run rate: Your simple, unadjusted figure.
- Adjusted run rate: The realistic figure after removing one-offs.
- Trailing 3-month run rate: The smoothed-out number that accounts for seasonality.
This proactive explanation shows you’re on top of your metrics. It frames you as a credible, data-driven leader. This is critical for building accurate startup financial projections.
Investor-ready reporting template
Use this simple framework in a pitch deck or investor update. You can grab our ready-to-use Google Sheets template to make it seamless.
| Metric | Calculation detail | Projected annual revenue | Founder’s note |
|---|---|---|---|
| Basic run rate | Last month’s revenue x 12 | $1,200,000 | Reflects our strong Q4 momentum. |
| Adjusted run rate | (LMR – one-off fees) x 12 | $1,050,000 | A more accurate view of core recurring revenue. |
| Trailing 3-month run rate | 3-month avg. revenue x 12 | $980,000 | Smooths out seasonality from the holiday spike. |
Presenting all three figures shows you understand the difference between a good month and a sustainable business.
Ready to turn your financial story into a deck that gets investors to say yes? We combine top-tier financial analysis with data-driven design to build pitch decks that convert. Learn more at /.
FAQ
What’s the difference between run rate and ARR?
This is a common point of confusion. For a subscription business, the distinction is critical.
Annual Recurring Revenue (ARR) is a precise metric. It measures only the recurring revenue from active subscriptions, normalized for a year. It’s your contracted, predictable revenue stream.
Run rate is a quick forecasting tool. It takes recent performance and multiplies it out.
– ARR is laser-focused on contractually recurring revenue.
– Run rate can include everything: recurring revenue, one-time fees, and variable charges.
For a SaaS business, true ARR is the gold standard.
How often should I recalculate my company’s run rate?
The right cadence depends on your audience.
– For internal use: Recalculate monthly. This gives you a regular pulse on performance.
– For external reporting: Use a quarterly calculation. This smooths out volatility for board meetings and investor updates.
A simple rule: use monthly run rates for internal execution and quarterly for external communication.
Can I use run rate for a pre-revenue startup?
No. A run rate calculation is based on existing revenue.
For pre-revenue startups, focus on leading indicators that predict future revenue.
– User growth and engagement rates.
– Pilot project sign-ups.
– Waitlist size and estimated conversion rates.
– Sales pipeline value.
Once you have your first month of consistent revenue, you can calculate an early run rate. Just frame it as a preliminary snapshot.
