
Staring at a blank spreadsheet feels like staring into the abyss. It’s overwhelming.
A solid startup financial projections template is your map. It turns your business plan into a financial story investors can actually get behind.
Think of it as the bridge between your vision and their checkbook. At its core, it projects your income statement, cash flow statement, and balance sheet over the next three to five years.
What goes into a startup financial projection template
Your template is more than just numbers. It’s your business plan translated into the language of money. It proves your idea is a viable, scalable business.
When investors open your model, they look for one thing: proof you understand your own business. How you make money, how you spend it, and how you stay afloat.
A well-built model shows you’ve thought through what drives your growth and what could sink you.
The three core financial statements
The entire model hinges on three key documents. They work together to paint a complete picture of your startup’s financial health. Each one answers a critical question.
Let’s break them down.
| Component | What it shows | Key question it answers |
|---|---|---|
| Income statement (P&L) | Your revenue and expenses over a period. | Are we making money? |
| Cash flow statement | The real-time movement of cash in and out. | Do we have enough cash to keep the lights on? |
| Balance sheet | A snapshot of assets, liabilities, and equity. | What is the company’s net worth? |
This trio is the foundation of any credible financial story. They’re interlinked. One without the others leaves a massive hole in your narrative.
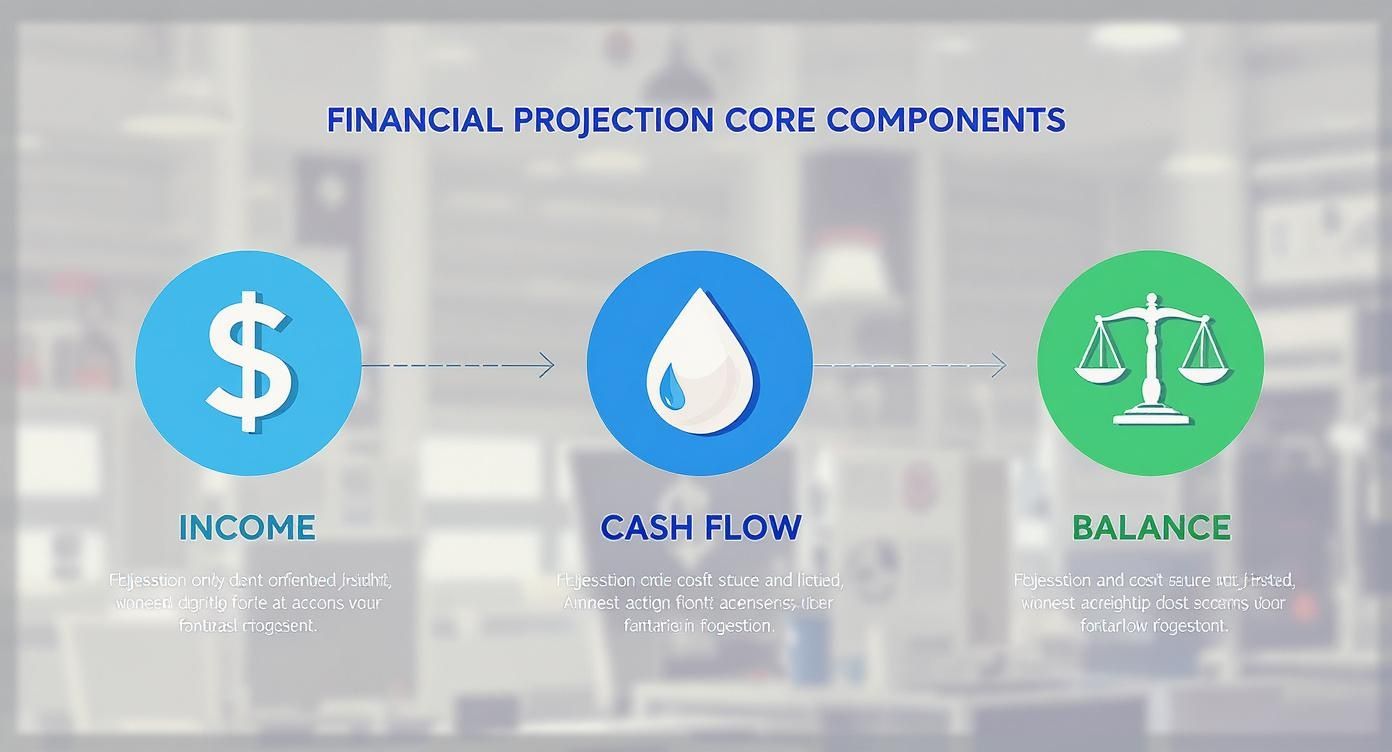
As you can see, profit isn’t the same as cash in the bank. Both impact your company’s value. Nailing this interplay is what separates the pros from the amateurs.
Top-down vs. bottom-up forecasting
Every forecast starts with a core assumption about growth. There are two ways to build this story: top-down or bottom-up.
The top-down approach starts with the total addressable market (TAM). You carve out your slice. It’s a great way to show the scale of the opportunity, but it can feel abstract.
A bottom-up forecast is grounded in reality. It starts with what you can control. You look at drivers like sales capacity, conversion rates, or pricing. This results in a more believable forecast.
For more detail, you can find deep dives into these financial projection methods.
For an early-stage startup, a bottom-up forecast is almost always the way to go. It connects your financial goals to your operational plan. That’s exactly what savvy investors want to see.
Example:
- Top-down: The global pet tech market is a $20 billion pie. We’ll capture 0.5% in five years, hitting $100 million in revenue.
- Bottom-up: We have 5 sales reps. Each can close 4 deals a month. At a $5,000 average deal size, our monthly revenue is $100,000. See how tangible that is?
How to build a realistic revenue forecast
Revenue is your startup’s engine. Investors have seen countless "hockey stick" graphs based on hope. You need to show your work.
Your goal is to build a revenue forecast from the ground up. Every dollar you project should be tied to a real-world operational assumption. This is called a bottom-up approach.
Model your revenue streams
First, don’t lump all your income into one bucket. Model each revenue stream separately.
Identify your primary streams:
- SaaS subscriptions: Predictable income based on monthly (MRR) or annual (ARR) contracts.
- E-commerce sales: Driven by traffic, conversion rates, and average order value (AOV).
- Usage-based pricing: Revenue that scales with customer activity, like API calls.
- Services or projects: One-off income from consulting or custom projects.
Breaking them out forces clarity. It proves you understand the mechanics of your business, which is critical for future funding rounds like we cover in our guide to raising Series B funding.
Define your core assumptions
A forecast is only as good as its assumptions. This is where your model meets your go-to-market strategy.
For every revenue stream, you need to define – and defend – the key drivers behind your growth. For a SaaS business, focus on these drivers:
- New customer acquisition: How many new customers do you sign up monthly? Tie this to your marketing spend or sales team’s quota.
- Pricing: What’s your average revenue per account (ARPA)? Model the customer mix for each pricing tier.
- Customer churn: What percentage of customers do you expect to lose each month? An annual churn rate of 5-7% is often seen as acceptable for early-stage SaaS.
An investor should be able to ask, "How did you get to $50,000 in MRR in month six?" You need a concrete answer.
Project growth over a 3-year timeline
Now, build the forecast. Go monthly for the first 12-24 months, then quarterly or annually for year three.
Start small and grow your assumptions logically. Don’t just slap a 20% month-over-month growth rate on it. Build a narrative. Show how things evolve as you scale. That’s a story an investor can believe.
Example: E-commerce revenue projection (Month 1)
Here’s a simple bottom-up calculation for a new e-commerce store.
| Metric | Assumption | Calculation | Result |
|---|---|---|---|
| Website Visitors | 10,000 | - | - |
| Conversion Rate | 1.5% | 10,000 * 1.5% | 150 Orders |
| Average Order Value (AOV) | $75 | - | - |
| Projected Revenue | - | 150 * $75 | $11,250 |
This approach is solid. It’s built on components you can test, justify, and debate. It’s a real plan, not just a number on a slide.
Mapping your startup costs and burn rate
Your revenue forecast sells the dream. Your expense forecast proves you can execute it.
Investors scrutinize costs to gauge your operational discipline. It’s not about being cheap – it’s about being smart with every dollar.
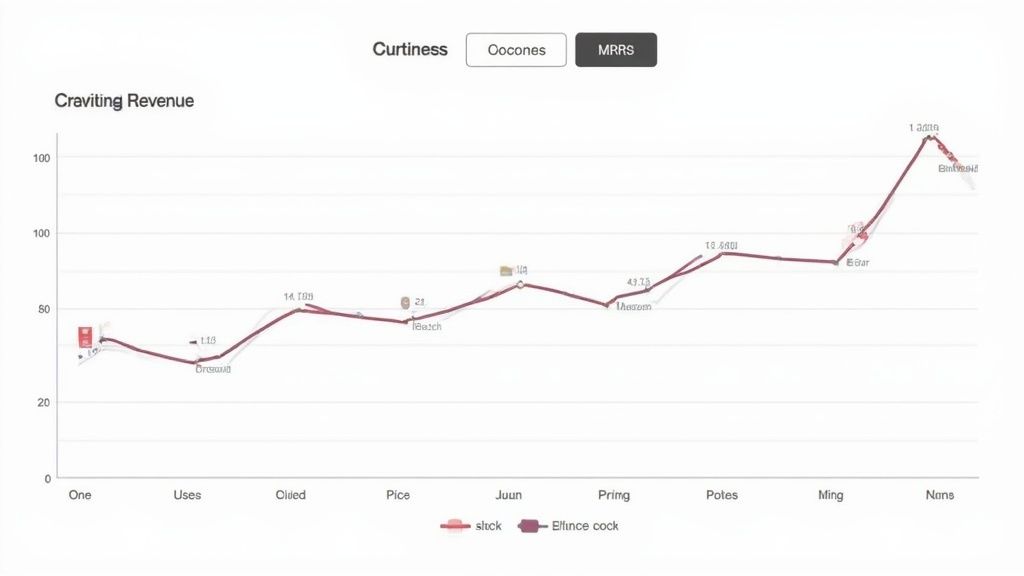
Let’s categorize and project your costs. Nailing this shows you’re a responsible steward of capital and helps you figure out how much to raise.
Breaking down your expenses
Investors expect to see spending in four standard buckets. Stick to this structure.
- Cost of Goods Sold (COGS): Direct costs to deliver your product. Think server hosting fees or raw materials.
- Sales & Marketing (S&M): Everything you spend to get and keep customers. Ad spend, sales commissions, tools like HubSpot or Salesforce.
- Research & Development (R&D): Your "build the product" budget. Salaries for your engineering, product, and design teams.
- General & Administrative (G&A): The cost of keeping the lights on. Rent, legal bills, executive salaries.
Understanding how these costs shift as you grow is critical. As your product matures, spending priorities change, a concept we cover in our guide on examples of the product life cycle.
A quick startup cost checklist
Think of this table as your starting point. Make sure every dollar you plan to spend has a home in one of these buckets.
| Expense Category | Description | Example Costs |
|---|---|---|
| COGS | Costs to produce your goods or deliver your service. | Server hosting, payment processing fees, raw materials, third-party software. |
| S&M | Expenses to attract, convert, and retain customers. | Digital ads, sales team salaries & commissions, CRM software, content. |
| R&D | Costs to create new products or improve existing ones. | Engineer salaries, product manager salaries, prototyping tools, development software. |
| G&A | Operational overhead to run the business. | Rent, utilities, legal fees, executive salaries, office supplies, insurance. |
Forecasting fixed vs. variable costs
Next, project these costs over time. Separate what stays the same from what scales with growth.
Fixed costs are predictable expenses. They don’t change much whether you have 10 or 1,000 customers. Think rent or full-time salaries.
Variable costs are tied to your business activity. For a SaaS company, this could be customer support agents. For e-commerce, it’s shipping fees. They go up as you sell more.
Calculating your burn rate and runway
With expenses mapped out, you can calculate the two metrics that determine your survival: burn rate and runway.
- Gross burn: The total cash your company spends each month.
- Net burn: Gross burn minus your revenue. It shows how much cash you lose each month.
- Runway: Total cash in the bank divided by your net burn. It tells you how many months you have until the lights go out.
Detailed projections help investors examine how your assumptions connect to revenue, costs, cash needs, and runway. SCORE’s financial projections template is a practical starting point.
Example: Calculating runway
Your startup has $500,000 in the bank. You bring in $20,000 in monthly revenue, but your total expenses are $70,000.
- Net burn: $70,000 (Expenses) – $20,000 (Revenue) = $50,000 per month
- Runway: $500,000 (Cash) / $50,000 (Net Burn) = 10 months
That founder knows they have 10 months to hit profitability or close their next round. That clarity is power.
Why your cash flow statement is critical
"Profit is an opinion, but cash is a fact."
It’s a startup cliché for a reason. Your income statement might look great. But if you can’t make payroll because the cash isn’t in the bank, you’re insolvent.
This is why the cash flow statement isn’t a nice-to-have; it’s non-negotiable. It tracks the real movement of money, answering the most important question: "When do we run out of cash?"

Mapping the reality of your bank account
The cash flow statement connects your revenue projections to the reality of your bank balance. It models the timing differences that can make or break a company.
Don’t just take my word for it. Around 71% of startups fail due to cash flow problems. That statistic alone should make you obsessed with rigorous forecasting.
Modeling key operational items
Two big items throw cash flow out of whack: accounts receivable and capital expenditures. Your model must account for both.
- Accounts receivable (A/R): The money customers owe you. You invoice a client for $20,000 on 30-day terms. Your income statement shows that revenue now, but your bank account sees nothing for a month. You must model that delay.
- Capital expenditures (CapEx): Big-ticket purchases like laptops or servers. A $10,000 server purchase is an immediate hit to your cash, but it’s not an operating expense you recognize all at once.
One common mistake is assuming revenue equals cash. If you have long payment cycles or major upfront costs, your cash position can diverge wildly from your reported profit.
Example: a single enterprise sale
Imagine you close a $120,000 annual contract in January. How you get paid changes everything.
- Income statement: You might recognize $10,000 in revenue each month. On paper, you look profitable.
- Cash flow (upfront): The customer pays the full $120,000 in January. Your cash balance spikes.
- Cash flow (quarterly): The customer pays $30,000 quarterly. You have to manage your burn carefully to make it to the next payment.
The cash flow statement is the only place this gets captured. It proves to investors you understand how to manage the lifeblood of your business.
Creating a KPI dashboard for investors
Your financial model is packed with raw data. Investors don’t have time to sift through every line item. They need the executive summary.
That’s what a Key Performance Indicator (KPI) dashboard is. It’s a clean, scannable tab in your spreadsheet that visualizes your startup’s health at a glance.
This dashboard translates your projections into a compelling story. It proves your business model isn’t just viable, but scalable.
Highlighting the metrics that matter
A great dashboard is a curated view of your company’s vital signs. For investors, a few are non-negotiable.
- Customer acquisition cost (CAC): How much you spend to get one new customer.
- Lifetime value (LTV): The total revenue you expect from a single customer.
- LTV to CAC ratio: The magic number. A ratio of 3:1 or higher signals a healthy business model.
- Gross margin: Revenue minus COGS, shown as a percentage.
- Monthly runway: How many months you can keep the lights on based on cash and net burn.
These KPIs are the universal language of venture capital. Displaying them clearly shows investors you speak their language. This makes the data from your startup pitch deck template immediately tangible.
Building your dashboard
You don’t need fancy software. A simple summary tab in your spreadsheet is all it takes.
Link the dashboard cells directly to the outputs in your financial statements.
To get your CAC, divide your total monthly sales and marketing spend by the number of new customers. This makes your dashboard a dynamic part of your model, not a static report.
Then use simple charts to bring the trends to life. A line chart showing your LTV/CAC ratio climbing over time is more powerful than a table of numbers.
Example: A simple LTV/CAC calculation
| Month | LTV | CAC | LTV to CAC Ratio |
|---|---|---|---|
| January | $750 | $300 | 2.5x |
| February | $780 | $290 | 2.7x |
| March | $820 | $275 | 3.0x |
This simple table instantly tells an investor that your customer acquisition is getting more efficient as you scale. And that’s a story worth funding.
Building investor-ready financial projections is just one piece of the puzzle. At Pitchili, we combine data-driven financial storytelling with world-class design to turn investor attention into term sheets. Let’s build your winning pitch deck.
FAQ
How far out should my financial projections go?
Three years is the standard for fundraising. Break down the first 12 to 24 months monthly. This granular view is non-negotiable for managing your cash flow. For year three, you can switch to quarterly or annual forecasts. Focus on nailing the accuracy of your first two years. That’s where investors will spend 90% of their time.
What’s the biggest mistake founders make?
The optimistic "hockey stick" revenue forecast that isn’t backed by realistic, bottom-up assumptions. Your model has to tell a consistent story. If you project explosive revenue growth, the costs to acquire those customers must also scale logically. A mismatch is a massive red flag. A model showing a deep understanding of your unit economics is always more impressive than one with giant, unsupported revenue figures.
Can I build this without a finance background?
A simple, well-reasoned model you can explain is far more powerful than a complex spreadsheet you don’t understand. For help, a resource like LivePlan’s blog can offer great starting points.
Should I include best-case and worst-case scenarios?
Yes. Scenario analysis is a sign of a seasoned founder. It shows you’ve thought critically about risk and opportunity.
I recommend creating three scenarios:
– Base case: Your most realistic and likely outcome.
– Best case: What happens if key assumptions over-perform? Think higher conversion rates or lower churn.
– Worst case: Your plan for headwinds, like slower customer acquisition or a spike in costs.
This demonstrates foresight and helps you understand how much runway you truly need. It turns your model from a forecast into a powerful planning tool.
