
Your financial model is where your vision meets reality. It translates your big idea into numbers-the language investors speak.
Most founders build something too complex or too simple. The sweet spot is a model that tells a clear, defensible story about your startup’s future. It proves you know your business inside and out.
Let’s build a practical, investor-ready model from scratch. We’ll skip the jargon and focus on what actually moves the needle.
Why a solid financial model matters
VCs bet on founders who have a deep grasp of their business mechanics. Gut feelings don’t close rounds. Data does.
The market reflects this. The global financial modeling market is set to grow from $2.36 billion in 2025 to $3.84 billion by 2029. That’s a 13% annual growth rate. You can see the full research on the financial modeling market.
A good model gives you three superpowers:
- Operational clarity: It connects the dots between marketing spend, customer growth, and cash in the bank.
- Investor credibility: It’s your proof of work. It shows you’ve thought through the details and can defend your assumptions.
- Strategic agility: It lets you play "what if." What happens if customer acquisition costs spike? A dynamic model helps you see around corners.
Your model is the quantitative proof behind the qualitative story in your pitch deck.
Example: The core components
A good financial model has several interconnected parts.
| Component | What it tells you | Key question it answers |
|---|---|---|
| Assumptions tab | The "brains" of the model. It holds all your key drivers like pricing and churn. | "What are the core levers that drive my business?" |
| Revenue model | The engine. It calculates your sales based on your assumptions. | "How will we make money, and at what scale?" |
| Hiring plan | Your team’s growth roadmap, tied to revenue and product milestones. | "Who do we need to hire and when?" |
| Profit & loss (P&L) | Your company’s performance over time-revenue, costs, and profit. | "Are we making a profit or a loss?" |
| Cash flow statement | The truth-teller. It tracks the actual cash moving in and out of your business. | "Will we have enough cash to survive and grow?" |
| Balance sheet | A snapshot of your financial health-assets, liabilities, and equity. | "What do we own, what do we owe?" |
Laying the foundation with a simple structure
Before writing a formula, think about structure. A clean layout is logical, auditable, and easy to trust.
The goal is a clear path from your core assumptions to your financial outputs. This separation of inputs, calculations, and summaries is a non-negotiable best practice.
Start with a dedicated assumptions tab
Every solid model begins with a dedicated tab for key drivers. This is the control panel for your entire forecast. Centralize your inputs in one clean place.
This makes your model dynamic and transparent. Want to see how a 10% price increase impacts runway? Update one cell. The entire model recalculates automatically.
Key drivers to include:
- Revenue drivers: Pricing, conversion rates, average contract value (ACV).
- Cost drivers: Customer acquisition cost (CAC), average salaries, software costs.
- Operating drivers: Churn rate, hiring timelines, payment terms.
Document each assumption. Add a comment explaining your rationale. Context is everything.
Example: Documenting an assumption
Instead of just entering "5%" for churn, add a note: "Based on average churn from our last six months of beta cohort data."
Separate your core financial statements
Next, build your core statements on separate tabs. This modular structure makes the model easy to navigate. An investor should be able to click through your P&L, balance sheet, and cash flow tabs without getting lost.
Your model’s structure should visually tell the story of how your business works.
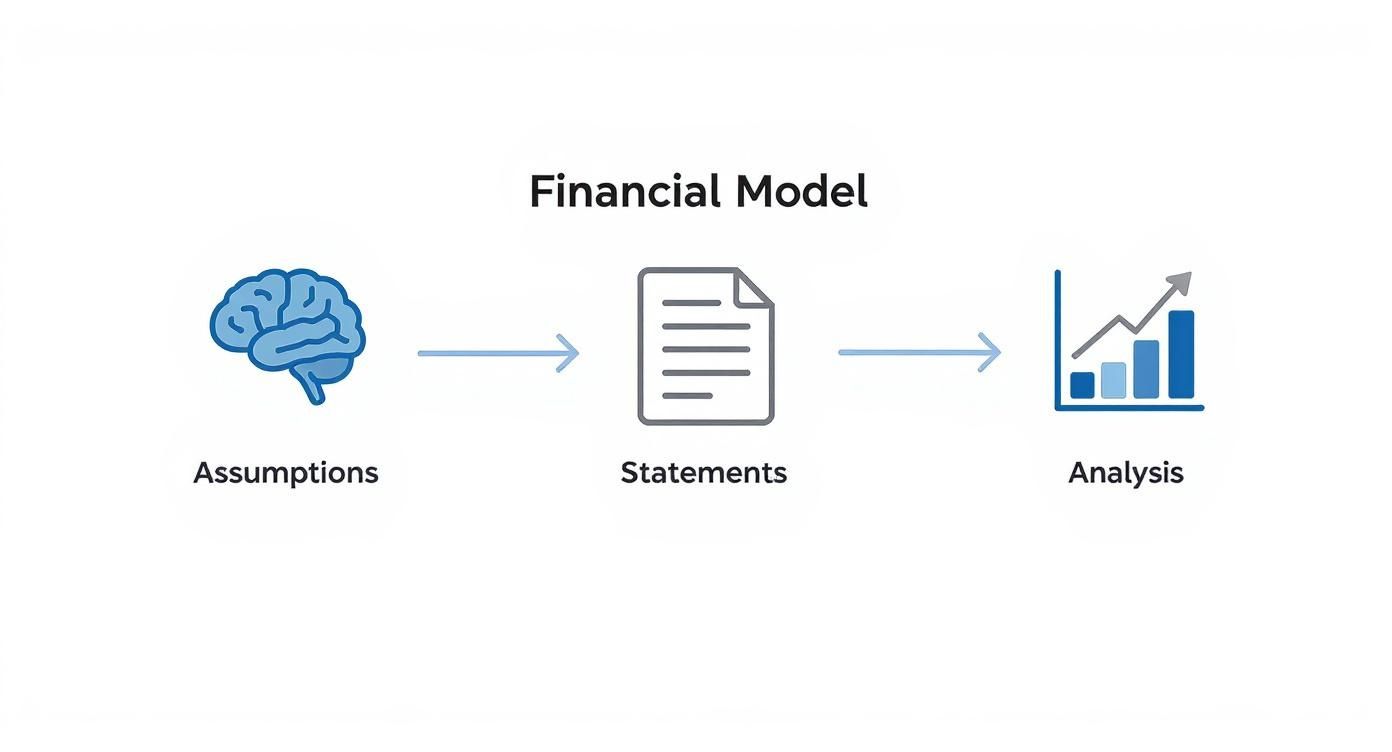
The non-negotiable tabs are:
- Income statement (P&L): Shows your profitability over time.
- Balance sheet: A snapshot of your company’s assets, liabilities, and equity.
- Cash flow statement: Tracks the actual cash moving in and out of your bank account.
This separation prevents a single, monstrous spreadsheet. If you want to see how these components work together, explore our startup financial projections template.
Example: A summary tab
Pull it all together with a 'KPIs & summary' tab. This dashboard pulls the most important outputs-like monthly recurring revenue (MRR) and cash runway-into one easy-to-read summary. This is often the first and last tab an investor will look at.
Defining assumptions that drive your business
Your financial model runs on assumptions. This is the most important part of building trust with investors. It’s where you translate your operational plan into numbers.
A model with weak assumptions is a fantasy. One with grounded assumptions is a credible forecast.
The demand for financial modeling experts is rising sharply. The market for these professionals is projected to grow at an 11.8% rate from 2021 to 2030. You can discover more insights about the rising demand for modeling experts.
Nailing your revenue drivers
Investors always start with revenue. Build a "bottom-up" forecast, not a "top-down" one.
A top-down forecast says, "We’ll capture 1% of a $50 billion market." This is lazy.
A bottom-up forecast starts with tangible inputs. For a SaaS business, this means breaking down how you acquire customers and turn them into revenue.
Your key revenue assumptions might include:
- Top-of-funnel leads: How many website visitors or demo requests per month?
- Conversion rates: What percentage of leads from each channel convert to paid?
- Pricing & mix: What are your subscription tiers? What percentage of new customers choose each one?
- Churn & expansion: What percentage of customers do you lose each month? How much new revenue comes from existing customers?
Example: Bottom-up revenue assumption
"Organic leads convert at 3%, while paid leads from our new campaign convert at 1.5%." This turns a guess into a data-informed projection.
Tying costs directly to growth
Your cost assumptions must be linked to your growth plan. Every dollar of cost should have a clear purpose.
This demonstrates capital efficiency, a trait VCs value. Think of your costs in two buckets:
- Cost of goods sold (COGS): Costs directly tied to delivering your product. For SaaS, this includes hosting (AWS), third-party data services, and support salaries.
- Operating expenses (OpEx): Costs of running the business-sales, marketing, R&D, and administrative salaries. Your hiring plan is the biggest driver here.
This shows an investor that you are strategically investing capital to fuel growth. For a deeper dive, check out our guide on what is unit economics.
Example: Linking costs to growth
"We will hire one new customer support specialist for every 100 new customers." Or, "We will hire a new account executive once we hit $80k in new MRR for two consecutive months."
Building the three core financial statements
Once your assumptions are set, it’s time to build the engine. Construct the three interconnected statements that tell your startup’s financial story. We’ll build them in a specific order.
This creates a dynamic system. A change in one cell ripples through the entire model.
Play videoHow to build a financial model that wins funding videoThis loads content from YouTube.
Start with the income statement (P&L)
First is the income statement, or profit and loss (P&L). It’s the top-down view of your company’s profitability.
Build your P&L on a monthly basis for the first 24 months. After that, switch to quarterly or annual projections. The early monthly detail is non-negotiable.
The structure is straightforward:
- Revenue: Pull this directly from your assumptions tab.
- Cost of goods sold (COGS): Subtract the direct costs of your service. Think hosting fees and support salaries.
- Gross profit: Revenue minus COGS. A critical metric for scalability.
- Operating expenses (OpEx): List all other costs-R&D, sales and marketing, G&A.
- Net income (or loss): The bottom line. This number feeds your next statement.
Example: A monthly P&L snippet
In January, your P&L shows $25,000 in MRR. Your COGS are $3,000 (server and Intercom costs). Your gross profit is $22,000. After subtracting $30,000 in OpEx, your net loss is ($8,000).
Move to the cash flow statement
Next, the cash flow statement. For an early-stage company, this is the most important document. Profit is a goal, but cash is oxygen. This statement shows what’s happening in your bank account.
The cash flow statement bridges your P&L’s accounting numbers and your real-world cash balance.
Here’s the flow:
- Start with net income: Take the bottom-line figure from your P&L.
- Add back non-cash expenses: Add back items like depreciation.
- Factor in changes in working capital: Account for changes in accounts receivable, accounts payable, and deferred revenue.
This calculation gives you your net change in cash.
Example: Cash flow in action
Your P&L showed a net loss of ($8,000). But you also collected $12,000 in cash from new annual subscriptions this month. Your cash flow from operations is actually a positive $4,000, despite the "loss."
Complete the loop with the balance sheet
Finally, the balance sheet. It’s a snapshot of your company’s financial health on a specific day. The rule is simple: assets = liabilities + equity. If this doesn’t balance, your model is broken.
The balance sheet is where everything comes together.
Here’s how to connect the dots:
- Assets: What you own. Includes cash (linked from your cash flow statement), accounts receivable, and equipment.
- Liabilities: What you owe. Think accounts payable, debt, and deferred revenue.
- Equity: The ownership stake. It’s shareholder capital plus retained earnings (last period’s retained earnings + this period’s net income).
When your model is integrated, any tweak to your assumptions will ripple through correctly.
Making your model dynamic
A static financial model is just a spreadsheet. A dynamic model is a strategic tool. It prepares you for tough VC questions.
Your model shouldn’t present a single, perfect future. Investors want to see that you’ve stress-tested your assumptions.
Building scenarios to test your assumptions
First, build in scenario analysis. This lets you toggle between different futures with a single dropdown. It’s a powerful way to show strategic foresight.
Create three core scenarios on your assumptions tab:
- Base case: Your most realistic forecast, grounded in current data.
- Upside case: Your optimistic scenario. What if a marketing channel performs 2x better than expected?
- Downside case: The one VCs care about most. What if your CAC doubles or a key hire doesn’t work out?
Example: Creating a scenario switch
Create a dropdown cell labeled 'scenario' with options for base, upside, and downside. Use a CHOOSE function next to key assumptions. For CAC, the formula might be =CHOOSE(ScenarioCell, 450, 300, 900).
Creating a dedicated KPI dashboard
Investors rarely dig through your P&L at first. They jump to the key performance indicators (KPIs). Your model needs a dashboard that visualizes the metrics that matter most.
This dashboard should pull data from your core statements and present it clearly. It becomes the summary page for every investor conversation.
Example: Founder’s KPI checklist for a SaaS model
| Metric | What it measures | Investor benchmark |
|---|---|---|
| LTV:CAC ratio | Lifetime value vs. customer acquisition cost. Shows ROI of marketing spend. | 3:1 or higher is healthy. |
| CAC payback period | Months to earn back the cost of acquiring a customer. Measures capital efficiency. | Under 12 months is strong. |
| Monthly cash burn | Net cash the company is losing each month. A critical operational metric. | Varies by stage, but must be manageable. |
| Runway | Months until you run out of cash. Calculated as Total Cash / Monthly Cash Burn. | Investors want 18-24 months post-funding. |
| Gross margin | Percentage of revenue left after COGS. Indicates profitability of your product. | 75%+ is a common software target. |
A clear view of monthly cash burn is critical. You can explore our guide on how to calculate burn rate to track it correctly.
Sanity checking your own numbers
Finally, play the role of a skeptical investor. Are your growth assumptions defensible?
AI is raising the bar for forecasting. Automation will handle over 65% of repetitive modeling tasks by 2025. Founders need robust, data-backed models. You can learn more about AI’s impact on financial modeling practices.
Stress-test your model:
- Check for plausibility: Is hiring 50 people in one month feasible?
- Benchmark against reality: How do your conversion rates compare to similar companies?
- The "CEO test": Do you genuinely believe you can build the team to hit your year-three numbers?
This final step builds conviction. When an investor questions an assumption, you’ll be ready.
Making your model pitch deck ready
Your full Excel model is for the data room, not the first pitch. No investor wants to squint at a spreadsheet during your presentation. They need visual highlights that tell a story in seconds.
The goal is to focus the narrative. A few well-designed charts communicate your potential far more effectively than a dense table.
Crafting the three essential charts
Your pitch deck needs to answer three questions visually: Where are you going? How will you survive? Is the business model sustainable?
Each chart should tackle one point.
- The 'hockey stick' revenue chart: Shows projected revenue growth over 3-5 years. Include historical revenue to ground the projections in reality.
- The cash flow & runway chart: Visualizes your monthly cash burn and cash balance. Mark when new funding will land. This proves you have a plan for managing capital.
- The unit economics & KPI chart: Proves your business model works. Track MRR growth, LTV:CAC ratio, and payback period over time.
Example: Formatting a chart for impact
For your revenue chart, use a simple bar or line graph. Plot annual recurring revenue (ARR) on the Y-axis and years on the X-axis. A clean title like "Projected ARR growth ($M)" is all you need.
Follow these rules for your visuals:
- Use clear labels: Label your axes and give each chart a descriptive title.
- Remove the clutter: Get rid of gridlines, borders, and unnecessary data labels.
- Stay on-brand: Use your brand’s colors consistently.
An investor should grasp the takeaway from each chart in three seconds.
Ready to turn your financial story into a deck that gets funded? The team at Pitchili combines VC-side experience with world-class design to build narratives that win investor attention.
FAQ
How far out should I project my financial model?
Investors expect a three to five-year forecast. The first 12-24 months must be detailed month-by-month. This is your operational plan. Investors will study this section to understand your burn rate and runway. For years three to five, you can switch to quarterly or annual numbers. The goal is to show your vision for scale, not perfect precision.
What are the biggest mistakes founders make?
I see the same preventable mistakes sink pitches. Avoid these.
– "Top-down" fantasy math. Saying you’ll capture 1% of a $50 billion market is a lazy credibility killer. Build your forecast from the "bottom-up."
– Hiding your assumptions. Put all critical drivers-CAC, churn, pricing-on a dedicated assumptions tab. Make them easy to find and review.
– Forgetting that cash is king. Profit is nice, but cash keeps the lights on. Your cash flow statement, burn rate, and runway are often more important than net income.
Should I use a template or build my model from scratch?
The best answer is a bit of both. Starting with a template is smart. It saves time and shows you how the core financial statements connect. But don’t just plug in numbers. The real learning comes from rebuilding the core logic yourself. This forces you to understand every formula and prepares you to defend your model under pressure. Use a template for the scaffolding, but take the time to customize and rebuild the engine.
