
Calculating gross margin is simple. It’s one of the most important metrics for any founder.
You subtract the Cost of Goods Sold (COGS) from your revenue. Then you divide that by your revenue. This single percentage tells you almost everything about your business’s health.
Gross margin in 60 seconds
Think of gross margin as a truth serum for your business model.
It strips away all other costs – marketing, engineering, rent – to answer one question: "How profitable is the actual thing we sell?" Your gross margin is the portion of each dollar left over to run the rest of the company.
This metric signals if you built something scalable. A healthy gross margin means you have strong pricing power. It shows your production or service delivery is efficient.
A low or shrinking margin is a red flag for investors. It means your costs are out of control or your business model is flawed.
Why it’s a founder’s most important metric
Your gross margin shapes your ability to grow. It helps answer tough questions.
- Is our pricing working? A weak margin might signal it’s time to raise prices.
- Can we afford to scale? This cash funds your sales, marketing, and product roadmap. No margin, no growth.
- How efficient are our operations? This metric reflects how well you manage delivery costs.
Your gross margin is the engine of your startup. A powerful one fuels growth.
Example: SaaS vs. staples
What’s a "good" gross margin? It varies by industry. Data from einvestingforbeginners.com shows consumer staples companies averaged 86% over 22 years. Information technology was closer to 63%. Know your industry’s benchmark to set realistic targets.
A practical gross margin calculation
Let’s calculate a gross margin. We’ll use a direct-to-consumer (DTC) brand as an example.
You don’t need complex software. All you need is a spreadsheet.
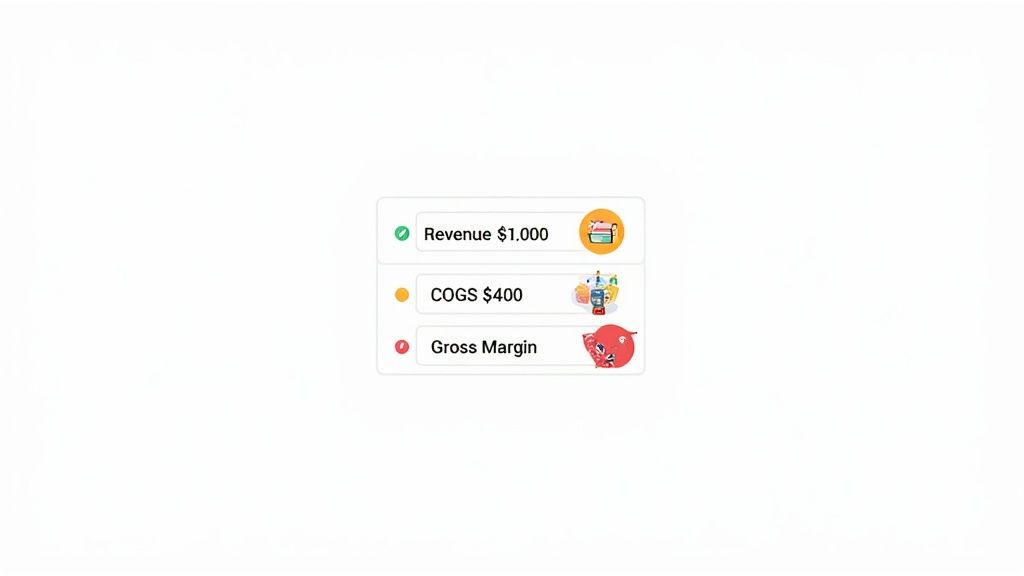
Step 1: isolate your revenue
Start with your Total Revenue. This is the gross income from all sales during a specific period.
Let’s say a DTC coffee brand made $500,000 in sales last quarter. That’s our revenue. It’s the total value of all coffee bags sold.
Step 2: define your cost of goods sold (COGS)
This is where founders often get tangled. COGS only includes the direct costs of producing your product.
It does not include marketing salaries, office rent, or your HR software subscription.
For our DTC coffee brand, COGS includes:
- Raw materials: The cost of green coffee beans was $120,000.
- Direct labor: Wages for employees who roast and package the beans totaled $45,000.
- Fulfillment costs: Packaging materials and shipping fees were $60,000.
Add those up: $120,000 + $45,000 + $60,000 = $225,000 in COGS.
The litmus test: Your COGS should scale directly with production. If you sell one more unit, these costs go up.
Step 3: put it all together
Now we have the two numbers we need. Getting these right is a critical step when you learn how to build a financial model.
Let’s use the formula:
Gross Margin = (Revenue – COGS) / Revenue
- Calculate Gross Profit: $500,000 (Revenue) – $225,000 (COGS) = $275,000
- Calculate Gross Margin: $275,000 / $500,000 = 0.55
- Turn it into a percentage: 0.55 x 100 = 55%
Example: DTC brand calculation table
| Line item | Amount | Notes |
|---|---|---|
| Total revenue | $500,000 | Total sales from all channels. |
| COGS – raw materials | $120,000 | Cost of green coffee beans. |
| COGS – direct labor | $45,000 | Wages for production staff. |
| COGS – fulfillment | $60,000 | Packaging and shipping costs. |
| Total COGS | $225,000 | Sum of all direct costs. |
| Gross profit | $275,000 | Revenue minus Total COGS. |
| Gross margin | 55% | Gross Profit divided by Revenue. |
Our DTC brand has a 55% gross margin. For every dollar of coffee sold, 55 cents are left to cover other expenses and eventually turn a profit. That number shows investors the health of the business.
What actually belongs in your cost of goods sold
Defining your COGS is where founders get tripped up. If you get it wrong, your gross margin is useless.
The principle is simple: COGS includes only the direct costs of creating your product. If a cost scales with each new sale, it’s COGS. If it’s a fixed cost, it’s an operating expense (OpEx).
But the lines get blurry. Let’s clear things up.
Defining COGS for a SaaS company
For software startups, your COGS is about keeping the service live and supporting customers.
What costs go up as you add users?
- Server and hosting fees: Costs for AWS or Google Cloud are direct expenses tied to usage.
- Third-party data and APIs: If your product relies on a paid API to function, the fees are COGS.
- Customer support salaries: Include the portion of salaries for teams directly involved in setup and technical support.
R&D and general engineering salaries are almost always OpEx. They build future value, not service current revenue.
Defining COGS for a hardware startup
Hardware is more straightforward, but nuances exist. COGS must capture every cost to get a finished product to the customer.
What’s included in hardware COGS?
- Component costs: Microchips, casings, screws – your bill of materials (BOM).
- Manufacturing labor: Wages paid to assembly line workers.
- Inbound freight: The cost to ship components from your supplier to your factory.
- Packaging: The box, inserts, and user manual are all part of the finished good.
- Payment processing fees: Fees from services like Stripe are a direct cost of a sale.
Your COGS calculation checklist
Use this checklist to ensure your numbers are solid for investor diligence.
| Item | Included in COGS? | Why or why not |
|---|---|---|
| Server hosting (AWS, GCP) | Yes | Scales directly with user activity and data storage. |
| Payment processing fees | Yes | A direct, variable cost tied to each revenue transaction. |
| Customer support salaries | Partially | Include the portion of time spent on direct user help. |
| Sales commissions | No | This is a cost of acquiring a customer, not delivering the product (OpEx). |
| R&D salaries | No | This is an investment in future product development (OpEx). |
| Inbound freight | Yes | A direct cost to get raw materials for production. |
| Outbound shipping to customer | Yes | A direct fulfillment cost to deliver the product. |
How gross margin varies across business models
A 75% gross margin is great for a SaaS company. It’s nearly impossible for a services agency.
Context is everything. Your margin tells a story about your scalability. That story changes depending on what you sell.
COGS becomes heavier as you move from software to physical goods and services. This directly impacts your potential gross margin.
The SaaS model: high margins, high expectations
SaaS businesses are prized for high gross margins, often 70% to 85%. The cost to serve one more customer is tiny.
- Typical COGS: Cloud hosting, third-party APIs, and a portion of customer support salaries.
- What VCs look for: A margin above 75% signals strong scalability.
High margins are why SaaS unit economics are so attractive to investors. The cash generated can be poured back into growth.
Example: a SaaS platform
A B2B SaaS company has $2M in annual revenue. Its COGS is $250,000 in hosting fees and $150,000 in customer support salaries.
- Total COGS = $250,000 + $150,000 = $400,000
- Gross Profit = $2,000,000 – $400,000 = $1,600,000
- Gross Margin = $1,600,000 / $2,000,000 = 80%
The hardware model: material costs and logistics
Hardware startups face a different world. A good gross margin might be 40% to 60%.
- Typical COGS: Component costs, manufacturing labor, freight, duties, and packaging.
- What VCs look for: A clear path to improving margins as you scale production.
The physical nature of the product means COGS will always be a significant chunk of revenue.
Example: a smart home device
A hardware company sells 10,000 units at $150 each, generating $1.5M in revenue. COGS per unit is $40 in materials, $15 in assembly, and $5 in packaging.
- Total COGS = ($40 + $15 + $5) x 10,000 units = $600,000
- Gross Profit = $1,500,000 – $600,000 = $900,000
- Gross Margin = $900,000 / $1,500,000 = 60%
The services model: people as COGS
For consulting firms and agencies, the primary COGS is people. Salaries of billable employees are your COGS.
This model is tough to scale. Margins typically fall between 20% and 40%. Growth requires hiring more people, which directly increases COGS.
How VCs look at your gross margin
Investors dissect your gross margin. They see it as a signal of your startup’s health and ability to scale.
A high and improving margin suggests a defensible business. A low or declining one is a red flag. It’s a forecast of your future cash flow.
Looking beyond a single number
VCs rarely care about a single, static figure. They hunt for the trend line. Is your margin ticking upwards? That’s a powerful sign of solid unit economics.
A 60% margin today might be fine if it was 50% a year ago. A positive trend is often more compelling than a high but stagnant margin. It proves your model gets more efficient as it grows.
Benchmarking against the industry
An investor will stack your margin against industry benchmarks. They know what’s incredible for SaaS is impossible for hardware.
While the market average gross margin is around 43%, this varies wildly. Retail automotive is near 22.3%, while some financial institutions approach 100%. Check out these average profit margins on Venasolutions.com.
Here’s a quick mental model VCs use:
- SaaS: The gold standard is 75% or higher.
- Hardware: 40% to 60% is the norm.
- Services: 20% to 40% is typical.
Framing your margin in a pitch deck
Don’t just drop the number and move on. Tell the story behind it. Show your current gross margin and its historical trend.
If your margins aren’t at the benchmark, address it head-on. Show investors you have a plan to close the gap. This builds massive credibility.
Your pitch deck is the key to unlocking investor meetings. At Pitchili, we combine VC insight with data-driven design to build presentations that turn attention into term sheets. Let’s build your story.
FAQ
Is gross margin the same as net profit margin?
No. This is a critical mistake. They tell two different stories.
– Gross margin is about the profitability of your core offering. It answers: "How much cash do we generate on each sale before overhead?"
– Net profit margin is your true bottom line. It subtracts every expense. It answers: "After paying for everything, are we making money?"
Gross margin shows the health of your business model. Net profit shows the health of your company.
Should I include sales commissions in COGS?
No. Sales commissions are a cost of acquiring a customer, not delivering the product. Commissions belong in operating expenses (OpEx) under "Sales & Marketing." This gives investors a clean read on your product’s inherent profitability.
How often should I calculate gross margin?
At a minimum, monthly. A monthly check gives you a tight feedback loop.
Tracking it monthly lets you:
– Spot trends early. Did a supplier hike prices? Monthly checks catch margin-eaters.
– Make smarter decisions. Adjust pricing or find operational leaks before they sink the ship.
– Build a believable forecast. A consistent track record makes your projections more defensible.
Your gross margin is a living metric. Treat it like a pulse check for your business.
Can my gross margin be negative?
Yes, and it’s a five-alarm fire. A negative gross margin means you lose money on every sale. You are literally paying customers to take your product. This signals a fundamental flaw in your pricing or cost structure.
