
If you can’t articulate your return on investment, you’re speaking a different language than your investors. You might have a great story, but without the numbers to back it up, you won’t secure funding. Learning how to calculate return on investment is the first step to turning your vision into a venture-backed business.
This guide will teach you the practical frameworks to move beyond a simple formula. You’ll learn how to calculate and present ROI in a way that builds investor confidence and justifies your valuation.
Key takeaways
- The basic ROI formula is (Net Profit / Cost of Investment) x 100, but the real challenge is accurately defining your costs and profits.
- Annualized ROI levels the playing field, allowing you to compare investments with different timelines.
- Sophisticated investors look beyond simple ROI and expect to see metrics like Net Present Value (NPV) and Internal Rate of Return (IRR).
- Weave your ROI calculations throughout your pitch deck-from the problem to the ask-to build a compelling, data-backed narrative.
- Avoid common mistakes like ignoring founder time as a cost, using overly optimistic projections, and presenting a single, static ROI figure.
Why mastering ROI is a non-negotiable skill for founders
For founders, return on investment (ROI) is more than just a metric. It’s the core of your investment story. It translates your vision and market potential into the universal language of finance that venture capitalists and angel investors understand.
A clear, defensible ROI projection shows you’ve thought beyond the product and are focused on building a scalable business. I’ve seen too many founders get stuck here. They have a killer product but can’t connect the dots to the financial outcomes investors need to see.
From a good story to an investable business
A compelling narrative is essential, but it’s the numbers that close the deal. Investors evaluate hundreds of opportunities, and their primary question is always the same: "If I give you this money, what will I get back, and when?"
A strong ROI calculation answers this question head-on.
Here’s why it’s so critical:
- It demonstrates financial discipline. This signals you understand that every dollar invested must generate a greater return.
- It builds credibility and trust. Solid, well-reasoned financial projections prove you’ve done your homework.
- It justifies your valuation. Your ROI provides a logical basis for your company’s worth.
Data from PitchBook shows that startups with clear financial projections are significantly more likely to secure follow-on funding. Master this, and your path to profitability becomes much clearer. You can find more insights about the ROI formula on corporatefinanceinstitute.com.
The foundational ROI formulas every founder should know
Before you can have a serious conversation with investors, you need to speak their language. That language is built on a few essential formulas. These are the building blocks for every financial model you’ll create.
They’re simple, direct, and universally understood.
Grasping the classic ROI formula
The most basic way to measure a return is with a simple percentage. This calculation gives you a clean snapshot of an investment’s profitability.
Here’s the formula:
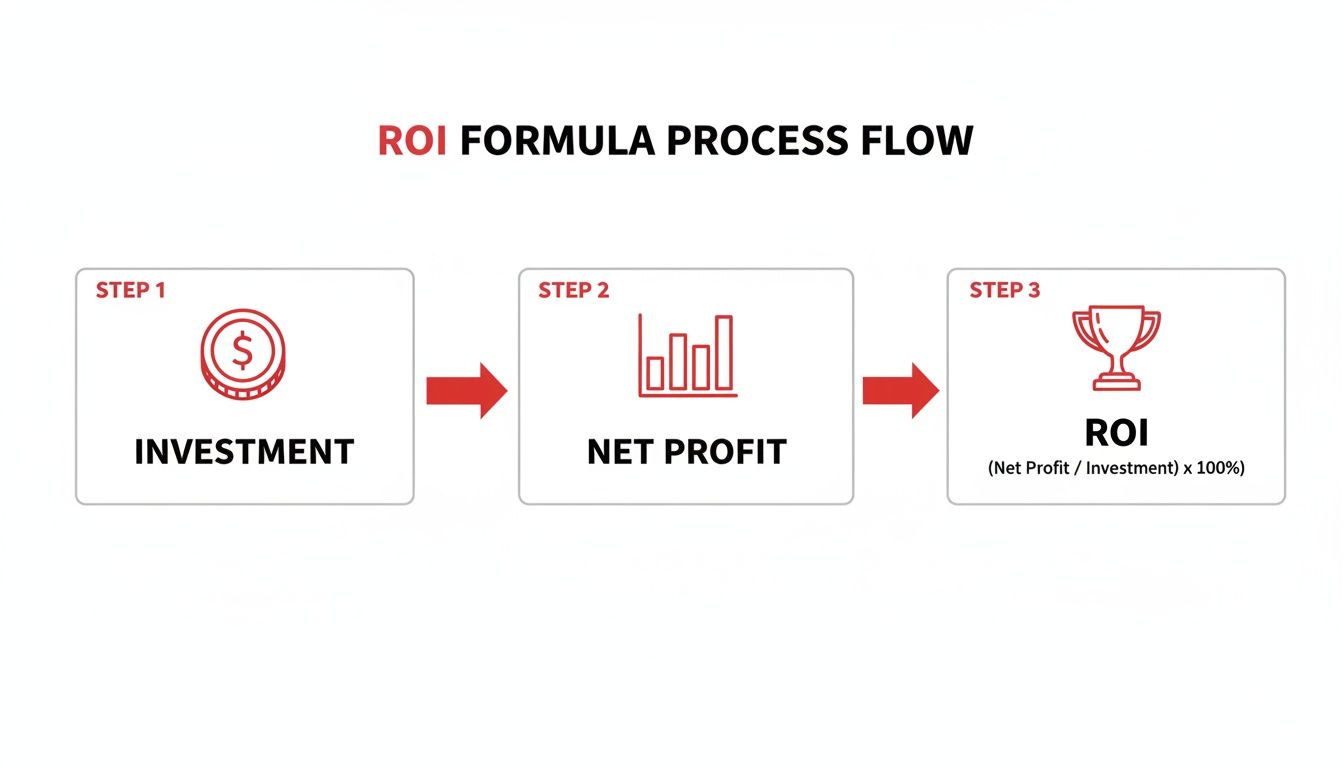
ROI = (Net Profit / Cost of Investment) x 100
The result is a straightforward percentage. A positive ROI means you made money. The real trick is accurately defining your "cost" and "profit."
For a founder, getting these numbers right is non-negotiable:
- Cost of Investment: This is more than cash spent. It’s the total resource commitment. That means ad spend, software licenses, and salaries for the team members involved.
- Net Profit: This is the actual financial gain you can attribute directly to that investment. To find it, take the revenue generated and subtract the cost of goods sold (COGS) and the investment cost itself.
Example: a SaaS marketing campaign
Imagine your SaaS startup invests $50,000 in a targeted digital marketing campaign. That is your Cost of Investment.
The campaign brings in 500 new customers who sign up for a $400 annual subscription. That’s $200,000 in new annual recurring revenue (ARR).
But revenue isn’t profit. Let’s say your gross margin is 80%, which means servicing these new customers (your COGS) costs $40,000.
First, find the gain from the investment:
- Gross Profit = $200,000 (Revenue) – $40,000 (COGS) = $160,000
Next, subtract the campaign cost to get the net profit:
- Net Profit = $160,000 (Gross Profit) – $50,000 (Campaign Cost) = $110,000
Now, plug it into the ROI formula:
- ROI = ($110,000 / $50,000) x 100 = 220%
That 220% ROI is a powerful number. It means for every dollar you spent, you generated $2.20 in profit. For a deeper look, you can explore some proven strategies and tips for measuring marketing ROI.
This calculation is tightly linked to customer value. To connect these dots, check out our guide on how to calculate lifetime value.
Annualizing ROI for better comparisons
Simple ROI is perfect for a self-contained project. But what if you need to compare two investments with different timelines? An investment that returns 50% in six months is better than one that returns 50% over five years.
Annualized ROI levels the playing field by standardizing the return over a one-year period. It lets you make a true apples-to-apples comparison.
The formula is:
Annualized ROI = [ (1 + ROI)^(1/n) – 1 ] x 100
Here, 'n' is the number of years you held the investment. Simple ROI gives you the "what," while annualized ROI provides the "how fast."
Example: a hardware R&D project
Let’s say a hardware startup invests $200,000 into an R&D project that takes three years to pay off. At the end of year three, the new tech generates a net profit of $300,000.
First, the simple ROI:
- ROI = ($300,000 / $200,000) x 100 = 150%
A 150% return looks incredible. But it took three years. To compare it to a one-year software project, we need to annualize it.
Using the formula with n = 3:
- Annualized ROI = [ (1 + 1.50)^(1/3) – 1 ] x 100
- Annualized ROI = [ (2.50)^(0.333) – 1 ] x 100
- Annualized ROI = [ 1.357 – 1 ] x 100 = 35.7%
The Annualized ROI is 35.7%. That number adds the critical context of time, which every good investor cares about.
Moving beyond basic ROI to impress sophisticated investors
As your startup grows, funding conversations change. Simple ROI is fine for early-stage pitches, but later-round investors expect a more nuanced financial story.
Experienced VCs want to see that you understand the time value of money-the principle that a dollar today is worth more than a dollar tomorrow. This is where metrics like Net Present Value (NPV) and Internal Rate of Return (IRR) come in.
Understanding net present value (NPV)
Net Present Value (NPV) answers a critical question for investors: "What is this future stream of profits worth to me right now, in today’s dollars?"
NPV discounts all future cash flows using a specific discount rate. This rate represents an investor’s minimum acceptable return or cost of capital, baking in the risk of the venture.
A positive NPV means the projected earnings from an investment (in today’s dollars) exceed the anticipated costs. Simply put, it’s a green light. A negative NPV is a clear red flag.
This transforms a simple ROI calculation from a static snapshot into a dynamic financial story that accounts for both time and risk.
Demystifying internal rate of return (IRR)
While NPV gives you a concrete dollar value, the Internal Rate of Return (IRR) gives you a percentage. You can think of IRR as the true annualized growth rate of an investment. It’s the specific discount rate that would make the NPV of all cash flows equal exactly zero.
In plain English, IRR is the breakeven rate of return. If an investor’s required return is 15% and your project’s IRR is 25%, it’s an attractive opportunity.
Seasoned investors use IRR to compare different opportunities. A project with a 30% IRR is a better bet than one with a 20% IRR, all else being equal.
A practical example for investors
Let’s put NPV and IRR into action.
Imagine an investor is considering a $1,000,000 investment in your company. Their required rate of return (the discount rate) is 20% per year-a typical figure for a startup.
Here are your projected cash flows back to the investor over the next five years:
- Year 1: $200,000
- Year 2: $300,000
- Year 3: $400,000
- Year 4: $500,000
- Year 5: $600,000
An investor will discount each year’s cash flow to find its value today. Using the NPV formula, the present value of these future cash flows is $1,344,557. Since this is well above the initial $1,000,000 investment, the NPV is positive ($344,557).
When we run the numbers for IRR on this same deal, we find it to be roughly 34.9%. This is significantly higher than the investor’s 20% required return, signaling a strong potential for profit.
These metrics provide a much clearer, more compelling picture than a simple ROI ever could. Specialized tools like an AI Finance Investment Analyst can help you model these scenarios quickly.
How to weave ROI into your pitch deck narrative
Knowing your numbers is only half the battle. Presenting them persuasively in a pitch deck is where you turn a good story into an investable business. Your job is to make your financial projections a core part of the narrative.
A compelling ROI story should be woven throughout your pitch, providing justification for your business model and a powerful reason for an investor to write a check.
Beyond the financials slide
Your ROI projections shouldn’t appear out of nowhere on slide ten. They need to feel like the logical conclusion to the story you’ve been telling.
Here’s where to strategically place ROI-centric arguments:
- The Problem: Hint at the financial inefficiency. "Companies in this space lose $2 billion annually due to X, representing a massive value-capture opportunity."
- The Solution: Frame your product’s value in terms of return. "Our platform reduces customer acquisition costs by 40%, delivering an immediate ROI for our users."
- The Ask: Justify your funding request by showing how that capital will generate a specific return. "We’re raising $2M to expand our sales team, which will unlock $10M in new ARR over 24 months, a 5x return."
Understanding how to build this kind of compelling story is fundamental. We break down how these pieces fit together in our guide on what is narrative structure.
Visualizing the return for investors
Investors are visual thinkers. A dense spreadsheet won’t land with the same impact as a clean, powerful chart. Your goal is to translate complex financial data into a visual story that is instantly understandable.
Here are two effective visuals to consider:
- Waterfall Chart: This is perfect for showing how an initial investment leads to a final return over time. It visually breaks down positive and negative contributions.
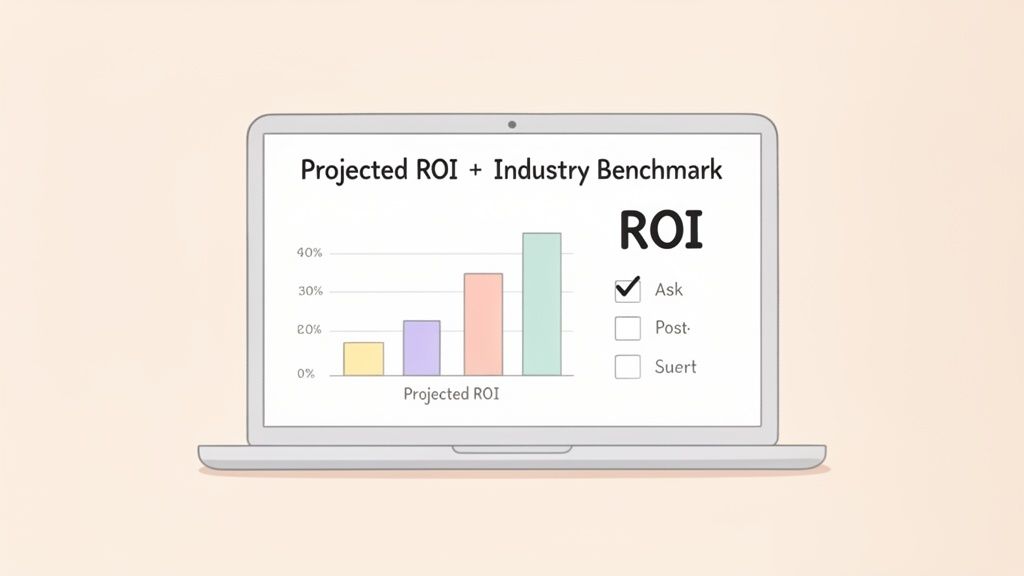
- Bar Chart Comparison: Use a simple bar chart to compare your projected ROI against industry benchmarks. This immediately frames your startup as a superior opportunity.
This approach of turning numbers into a clear visual story is a core principle of our pitch deck design services.
Your financial data presentation checklist
Before you finalize your slides, run through this quick checklist.
- Is the story clear? Can an investor understand your path to profitability in 30 seconds?
- Are assumptions stated? Have you clearly listed the key assumptions (e.g., CAC, LTV, churn rate) driving your projections?
- Is it visually clean? Does your design highlight the most important numbers?
- Is the 'ask' justified? Is there a direct, logical line from the capital you’re raising to the return you’re projecting?
- Is it defensible? Are you prepared to walk through your model and defend every number?
Common ROI mistakes that can sink a pitch
Knowing how to calculate ROI is one thing; knowing how to present it without getting laughed out of the room is another. An investor’s confidence is built on the credibility of your numbers, and a few common mistakes can shatter that trust instantly.
This is about discipline, honesty, and showing a grounded, realistic view of your business.
Ignoring hidden and indirect costs
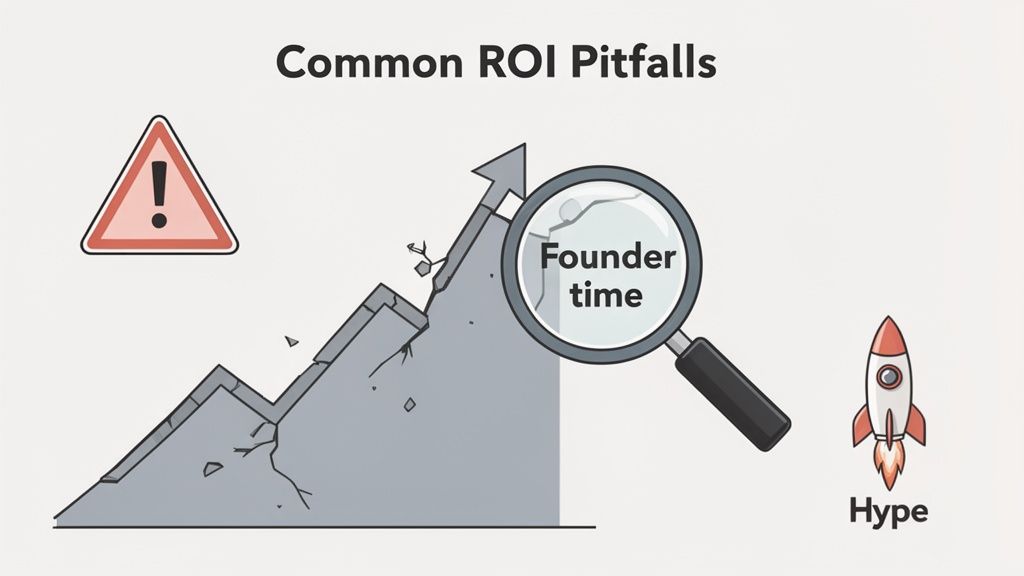
This is the fastest way to lose credibility. Presenting an ROI based only on obvious expenses like ad spend makes investors think you’re either naive or fudging the numbers.
The most commonly "forgotten" costs are:
- Founder and Employee Time: This is a huge one. If three of your engineers spend a month building a new feature, their fully-loaded salaries for that period are part of the investment.
- Cost of Capital: The money you’re using has an opportunity cost.
- Overhead Allocation: Every project is supported by your rent and utilities. A portion of those costs should be factored into your investment figure.
A good rule of thumb is to ask, "What are all the resources we pulled off something else to make this happen?" That’s your true investment.
Using overly optimistic projections
Every founder has to be an optimist, but when that optimism makes your financial models look like a fairy tale, it becomes a massive red flag. Investors have seen thousands of "hockey stick" growth charts that immediately flatlined.
Your projections aren’t just numbers; they’re a test of your judgment. Ground every assumption in real-world data-either from your own traction, close competitors, or established industry benchmarks from sources like Gartner. It shows you’re ambitious but also tethered to reality.
You can learn more about how founders often misstep in this helpful article from Forbes.
Presenting a single ROI figure
Dropping a single, static ROI number-like "our projected five-year ROI is 850%"-is a rookie move. It screams that you haven’t considered any variables or risks.
Smart founders present a sensitivity analysis. It shows a range of potential outcomes based on how your key assumptions play out.
Here’s an easy way to frame it:
- Best-Case Scenario: What happens if our key drivers (like conversion rate or LTV) perform better than expected?
- Base-Case Scenario: Our most realistic projection, grounded in solid data.
- Worst-Case Scenario: What does the picture look like if things go south? This shows you have a plan for adversity, not just success.
Presenting this range proves you’ve thought critically about the risks.
Turning your ROI story into investor confidence
Knowing how to calculate return on investment isn’t just a math exercise-it’s about proving you’re a disciplined founder who can be trusted with capital. You now have the tools to run the numbers and weave them into a story that connects with VCs.
The single most important thing you can do now is go back to your financial projections and stress-test them with these ROI methods.
A great next step is to strengthen your underlying assumptions. You can do that by learning how to build a financial model that withstands the toughest investor questions. This rigor shows you’re not just a visionary, but a sharp operator who understands how to deliver returns.
We at Pitchili can help you turn that powerful ROI into a pitch deck that gets meetings and term sheets.
FAQ
What is a good ROI for a startup investor?
There isn’t one magic number. A "good" ROI depends on the startup’s stage and industry. Early-stage VCs typically look for opportunities with the potential for at least a 10x return over 7-10 years. Aiming for a projected annualized ROI of 30-50% or higher is what gets them interested, as it compensates for the high risk involved.
How do you calculate ROI for a pre-profit company?
For a pre-profit company, calculating ROI is a forward-looking projection. You forecast future net profits and compare them to the total investment needed. For example, if you’re raising $1 million and your model shows this capital will help generate $5 million in net profit over five years, your projected ROI is 400%. The key is a logical, defensible model built on sound assumptions like customer acquisition cost (CAC) and lifetime value (LTV).
Can you calculate ROI on a marketing campaign?
Yes, and you absolutely should. It proves capital efficiency. The formula is: (Sales Growth from Campaign – Marketing Cost) / Marketing Cost. If you spend $20,000 on a campaign that generates $100,000 in sales with a 60% gross margin, your net gain is $40,000 ($60,000 profit – $20,000 cost). Your marketing ROI is ($40,000 / $20,000) * 100 = 200%.
What is the difference between ROI and ROAS?
This is a critical distinction. ROAS (Return on Ad Spend) measures top-line revenue from ads (Revenue / Ad Cost). It shows ad effectiveness. ROI (Return on Investment) measures true profitability by looking at the net profit from the entire investment, factoring in all costs. You can have a great ROAS but a negative ROI if your product margins are thin. Investors focus on ROI because profit builds a sustainable business.
