
You’re obsessed with monthly revenue and user growth. But the real story of your business’s health isn’t just today’s cash flow.
It’s the total value each customer brings you over time. This is customer lifetime value (LTV).
Get it wrong, and you’ll burn cash on customers who churn before you profit. Get it right, and you build a high-growth, durable company. This guide will show you how.

Why LTV is your most important metric
Investors fixate on LTV for a simple reason. It signals if your business model is sustainable.
MRR tells you what happened last month. LTV forecasts your future.
A solid LTV helps you make smarter decisions. It tells you exactly how much to spend on acquisition and which channels are profitable. It also shows you which customers are your true VIPs.
Keeping customers is far cheaper than finding new ones. It costs five times more to acquire a new customer than to retain an existing one, according to research shared by Delighted.com. LTV keeps you focused on building lasting value.
Three essential LTV calculation methods
There isn’t one "right" way to calculate LTV. The best method depends on your business model and data maturity.
A pre-seed startup doesn’t need the same precision as a public company.
We’ll cover three approaches, from a quick estimate to a precise forecast.
The simple LTV formula
This is your back-of-the-napkin calculation. It’s perfect for early-stage companies needing a baseline.
The formula gives you a revenue-based snapshot using three inputs:
- Average purchase value (APV): The average amount a customer spends per transaction.
- Purchase frequency (F): How often a customer buys in a set period (e.g., per year).
- Customer lifespan (T): The average time a customer stays with you.
The formula is simple multiplication:
LTV = APV x F x T
- Example: You run a coffee subscription box. The average order is $40 (APV). Customers order once a month, or 12 times a year (F). They stick around for 2.5 years (T). Your Simple LTV is $40 x 12 x 2.5 = $1,200. Each customer is worth $1,200 in revenue.
The gross margin LTV formula
The simple formula ignores profitability. It tells you what a customer brings in, not what you keep.
This method adjusts for your cost of goods sold (COGS). It paints a much more realistic picture.
First, find your gross margin percentage:
Gross Margin % = (Total Revenue – COGS) / Total Revenue
Then, apply it to your simple LTV:
LTV = (APV x F x T) x Gross Margin %
- Example: For your coffee box, the Simple LTV is $1,200. The coffee, packaging, and shipping for each box cost you $15. Your revenue per box is $40. Your gross margin is ($40 – $15) / $40 = 62.5%. Your Gross Margin LTV is $1,200 x 0.625 = $750.
This is a huge difference. Each customer generates $750 in profit, not revenue.
Predictive LTV models
For mature businesses with historical data, backward-looking models fall short. They assume customer behavior never changes.
Predictive LTV uses historical data to forecast future spending. These models use machine learning to spot trends and create accurate projections. You can learn more about these advancing methods at ContentSquare.
Predictive LTV is a methodology, not just a single formula. It analyzes factors like purchase recency and customer tenure. This helps predict who will churn and who will become a VIP.
- Example: A predictive model might find that customers who buy an add-on in their first 30 days have a 2x higher LTV. This insight is gold. You can now nudge new users toward that high-value action.
Calculating LTV for SaaS and subscription models
For SaaS businesses, LTV is a different beast. Your model is built on recurring revenue. Retention is your most important lever, and churn is your biggest enemy.
A single percentage point change in churn can be the difference between a growth engine and a sinking ship.

The standard SaaS LTV formula is simple yet powerful. It links revenue per customer directly to your retention rate.
The go-to SaaS LTV formula
This approach uses your average revenue per account (ARPA) and customer churn rate.
LTV = ARPA / Customer Churn Rate
This works because the inverse of your churn rate (1 / Churn Rate) estimates your customer lifetime. For example, a 5% monthly churn means an average customer lifetime of 20 months (1 / 0.05).
Baremetrics offers more great examples of this in action. A common shorthand is LTV = ARPU ÷ Churn Rate.
How to calculate ARPA and churn accurately
The formula is only as good as its inputs.
1. Calculate your average revenue per account (ARPA)
ARPA is your average revenue per account over a period, usually a month.
- Formula: ARPA = Total MRR / Total Number of Active Customers
- Example: If your MRR is $50,000 from 500 customers, your ARPA is $100.
- Note: Exclude trial and freemium users for an accurate number.
2. Calculate your customer churn rate
Churn is the percentage of customers who cancel in a period.
- Formula: Customer Churn Rate = (Customers Lost / Customers at Start of Period) x 100
- Example: You start a month with 500 customers and lose 25. Your monthly churn is (25 / 500) x 100 = 5%.
Now, put it all together.
- ARPA: $100
- Monthly churn: 5% (or 0.05)
LTV = $100 / 0.05 = $2,000
On average, each new customer is worth $2,000 in lifetime revenue.
- Example: The formula gives you a powerful metric to track. If your ARPA is $100 and monthly churn is 5%, your LTV is $2,000. This tells you each new customer generates $2,000 in revenue over their lifetime.
The LTV to CAC ratio: your growth engine
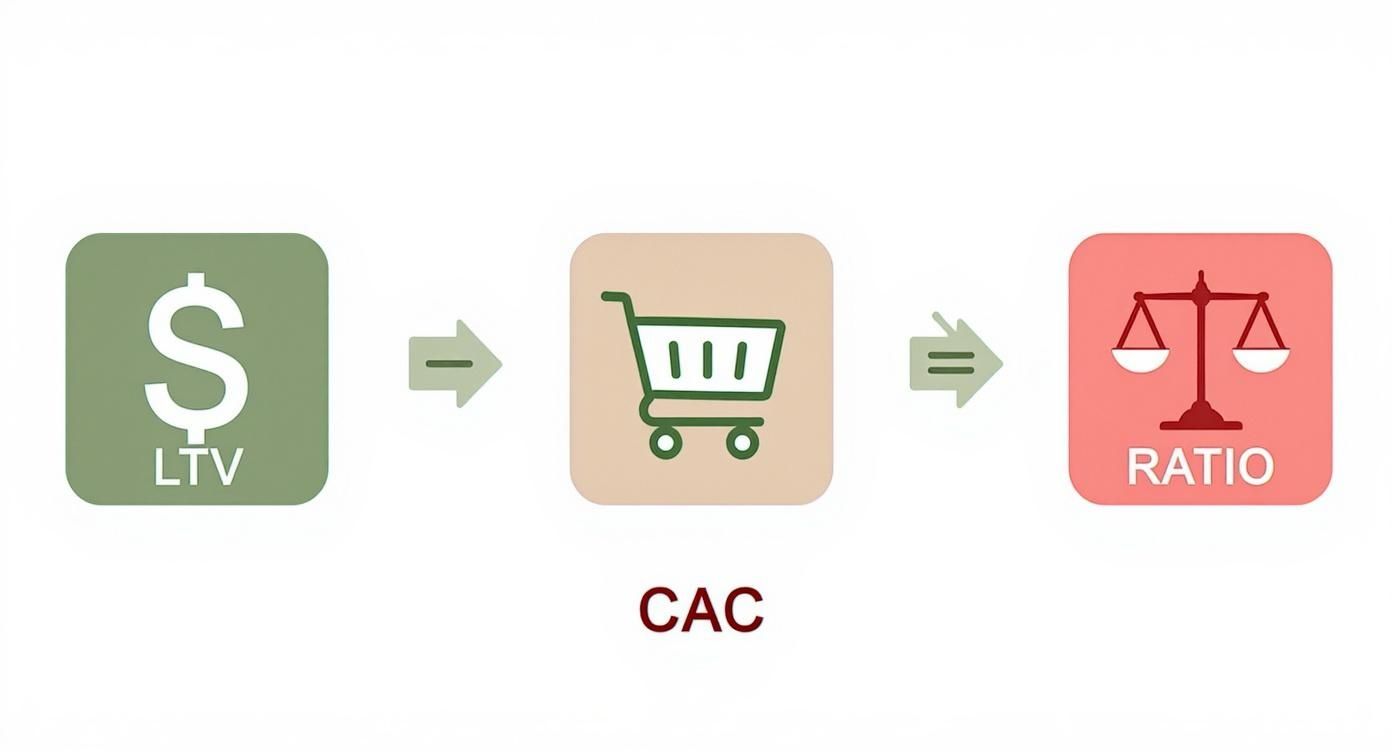
LTV is meaningless in a vacuum. Its real power comes when you compare it to your customer acquisition cost (CAC).
The LTV to CAC ratio is the clearest indicator of your business model’s health. It tells you and your investors that you have a sustainable growth engine.
First, calculate your customer acquisition cost
Your CAC isn’t just your ad spend. It includes every cost to win a new customer.
- Total marketing expenses: Ads, content, tools.
- Total sales expenses: Salaries, commissions.
- Overhead: A portion of software and support costs.
The formula is:
CAC = (Total Marketing & Sales Expenses) / Number of New Customers Acquired
For a detailed breakdown, see our guide on how to calculate customer acquisition cost.
Putting LTV and CAC together
Once you have both LTV and CAC, the ratio is simple division.
LTV to CAC Ratio = LTV / CAC
- Example: Our B2B SaaS company has an LTV of $2,000. Last quarter, they spent $100,000 on sales and marketing to acquire 200 new customers. Their CAC is $100,000 / 200 = $500. The LTV to CAC ratio is $2,000 / $500 = 4:1.
Interpreting your LTV to CAC ratio
This ratio is a strategic guide. A healthy SaaS business benchmark is 3:1 or higher.
- Below 1:1 (Danger zone): You’re losing money on every new customer. This is unsustainable.
- 1:1 to 3:1 (Needs improvement): You’re profitable, but the margin is thin. Focus on improving retention or finding more efficient acquisition channels.
- 3:1 to 5:1 (The sweet spot): This is the target. You have a solid, repeatable model. Investors see this as a signal to add fuel.
- Above 5:1 (Potential for faster growth): A very high ratio may mean you’re underinvesting in growth. You might have an opportunity to spend more aggressively to capture market share.
LTV action framework
Theory is great, but execution gets you funded. Here’s a playbook to put LTV metrics into practice.
This framework translates your LTV to CAC ratio into clear action.
| Ratio | Action item |
|---|---|
| < 1:1 | Code red. Pause paid acquisition. Fix your unit economics by raising prices or cutting costs. |
| 1:1 to < 3:1 | Improvement zone. You’re barely breaking even. Optimize your funnel, boost retention, and find cheaper acquisition channels. |
| 3:1 to 5:1 | The growth engine. You have a healthy, scalable model. Double down on your winning channels. |
| > 5:1 | Scale aggressively. You might be underinvesting. Ramp up marketing and sales spend to capture more market share. |
This isn’t just a framework for your team. It’s how investors will size up your business.
A founder who can state their LTV to CAC ratio and explain their plan to improve it is a founder VCs want to fund. It’s also the bedrock of a solid financial model. You can see how these metrics fit into the bigger picture with our startup financial projections template.
How to talk about LTV with investors
Play videoHow to calculate lifetime value: A founder’s guide videoThis loads content from YouTube.
In a pitch meeting, dropping your LTV number isn’t enough. VCs want to see you have a deep command of your unit economics.
The goal is to prove you’re using numbers to make smart decisions that build a valuable company.
Go beyond the single number
A standalone LTV figure is forgettable. Give it context to make it credible.
Be ready to break down your calculation on the spot. Walk them through your inputs and assumptions.
- Explain your inputs: "Our LTV is $1,600. We got there with an ARPA of $100 and a monthly churn of 6.25%."
- Acknowledge your assumptions: "We know our churn data is from a small base. Our forward-looking model uses a more conservative 7% churn rate."
This transparency builds trust. It shows you think critically about your own numbers.
The power of cohort analysis
The best way to tell your LTV story is through cohort analysis.
Showing LTV broken down by customer sign-up month is a game-changer. It visualizes your progress and proves your product is getting stickier.
- Example: Show how the 6-month LTV for your Q1 cohort was $450, but for Q2, it jumped to $550. Explain why it improved – maybe a new feature or marketing strategy. This proves you have your hands on the levers of the business.
Visualize LTV in your pitch deck
LTV deserves its own slide. A simple, clean visual is more effective than a dense spreadsheet.
A great unit economics slide needs three things:
- LTV Calculation: A simple breakdown.
- CAC Calculation: Show your cost right next to it.
- The LTV/CAC Ratio: This is the punchline.
A chart showing your LTV/CAC ratio improving from 2:1 to 4:1 tells a powerful story.
Ready to build a pitch deck that tells a compelling story with your LTV? Pitchili combines VC insight with data-driven design to help you turn investor attention into term sheets.
