
Struggling to prove your product has staying power? A single metric can show investors you’re building a business, not just a feature.
This guide gives you the exact formula, tools, and framework to calculate customer retention rate. No fluff. Just actionable steps to get numbers you can stand behind.
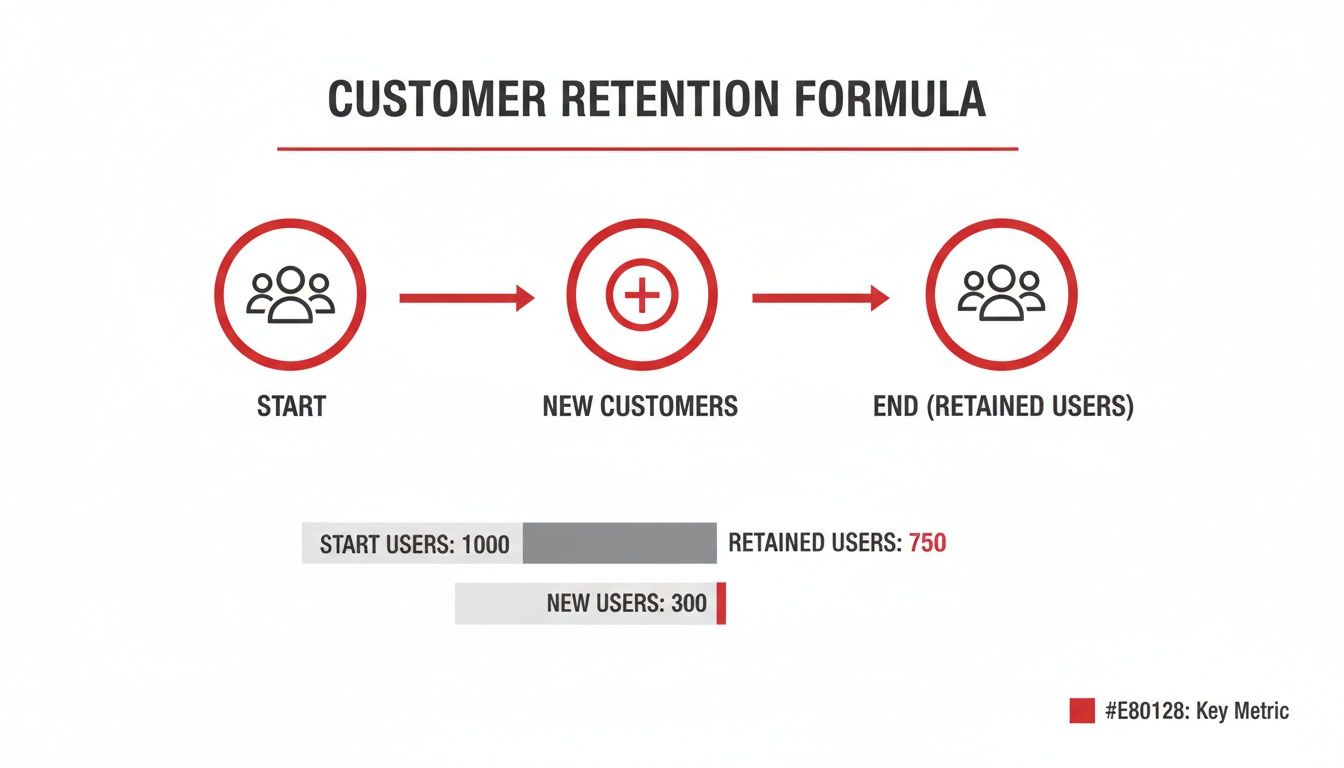
The core formula is: ((customers at end – new customers) / customers at start) x 100.
This tells you what percentage of customers you kept over a period. It’s a clean signal of product health.
Why retention is the metric that matters most
Growth is exciting. Retention builds a sustainable business.
For founders, knowing this metric is non-negotiable. It’s a pure signal of product-market fit – something investors will scrutinize. A high retention rate proves you’ve built something people value.
Strong retention directly impacts your customer lifetime value (LTV). A 5% boost in retention can increase profits by 25% to 95%, according to Bain & Company.
But before you calculate, you need to define two things. Get these wrong, and your numbers are useless.
First, define an 'active' customer
What does "active" mean for your business? The definition must match your model.
Is it a login? A key action? A paying subscriber?
- SaaS business: An active customer is a paid subscriber.
- Mobile app: A user who opened the app in the last 30 days.
- E-commerce store: A customer who made a purchase last quarter.
Clarity is everything. An inconsistent definition kills credibility. Be precise and stick to it.
- Example: A B2B SaaS defines an active customer as any account that has logged in and used a core feature at least once in the past 30 days.
Next, choose the right time frame
Now, decide on the period. This depends on your business model.
- Monthly is standard for SaaS with monthly billing.
- Quarterly works for longer sales cycles.
- Annually is for enterprise products with long-term contracts.
Whatever you choose, be consistent. Comparing a monthly rate to a quarterly one doesn’t work.
- Example: A startup with a monthly subscription plan tracks retention monthly to align with its billing cycle and quickly spot trends.
The customer retention formula breakdown
This table gives you a simple, at-a-glance view of each component in the retention formula.
| Component | What it means | Example |
|---|---|---|
| Customers at start (S) | Total customers at the beginning of the period. | You had 1,000 customers on Jan 1. |
| Customers at end (E) | Total customers at the end of the period. | You had 1,150 customers on Jan 31. |
| New customers (N) | New customers acquired during the period. | You acquired 200 new customers in Jan. |
With these definitions, you can calculate a metric investors trust.
Go beyond a single number with cohort analysis
A single retention rate is a snapshot. It’s a health check, but it hides the real story.
To speak an investor’s language, you need a moving picture: cohort analysis.
This is the gold standard for tracking retention. You group users into cohorts – usually by sign-up month – to see trends over time.
It helps you see if your product is getting stickier. Are June sign-ups staying longer than January’s? This is hard evidence your product improvements are working. That’s the momentum VCs want.
Why a simple rate can be misleading
Imagine your overall monthly retention is a steady 90%. Looks healthy, right?
But that single metric might hide a leaky bucket. Older customers could be propping up the average while new users churn fast.
- Example: Startup A reports a flat 92% monthly retention for Q1. But a cohort analysis shows the January cohort retained 95%, February 91%, and March only 88%. The overall number hid a clear downward trend. Without cohorts, you’re flying blind.
How to build a basic cohort table
You don’t need complex tools. A simple spreadsheet works.
It’s one of the most effective visuals for a pitch deck.
Here’s the structure:
Rows: Each row is a cohort (e.g., "January 2024 Signups").
Columns: Each column is a month after sign-up (Month 0, Month 1, etc.).
Cells: The percentage of the original cohort still active.
Example: A SaaS startup’s cohort data shows its March cohort has 91% Month 1 retention, up from 85% for its January cohort. This tells a powerful story: each new cohort retains better than the last, proving the product is improving. Learn more in our guide on what cohort analysis reveals about your startup.
How to get the numbers: spreadsheets vs. SQL
Theory is one thing. Execution is everything.
You know the formula. Now you need to get the numbers – today.
We’ll cover two methods. First, a simple spreadsheet for early-stage founders. Second, a clean SQL query for those with a production database.
Let’s get your data working for you.
Use spreadsheets for a quick start
For most early startups, a Google Sheet is the fastest way to track retention.
All you need is clean data. Create a table with these columns:
- Customer ID: A unique identifier.
- Sign-up date: When the user created their account.
- Last active date: The last time they performed a meaningful action.
From there, you can calculate your monthly metrics.
- Example spreadsheet calculation: To find your retention for February 2024:
- Customers at start (S): Count users with a sign-up date before Feb 1. Let’s say it’s 500.
- New customers (N): Count users who signed up during February. Let’s say it’s 75.
- Customers at end (E): Count total active customers at the end of Feb. Let’s say it’s 540.
- Calculation:
((540 – 75) / 500) * 100 = 93%. Your retention for February is 93%.
Run SQL queries for deeper insights
As you scale, pull metrics directly from your database using SQL.
It gives you the power to run calculations on the fly and build cohort analyses.
Here are two practical PostgreSQL queries you can adapt.
Calculate simple retention rate with SQL
This query mirrors our spreadsheet example. It counts your starting, new, and ending customers.
You just need a users table with an id and a created_at timestamp.
WITH start_of_period AS (
    SELECT '2024-02-01'::date AS period_date
),
customers AS (
    SELECT
        id,
        created_at::date
    FROM
        users
),
period_metrics AS (
    SELECT
        (SELECT COUNT(id) FROM customers WHERE created_at < (SELECT period_date FROM start_of_period)) AS starting_customers,
        (SELECT COUNT(id) FROM customers WHERE created_at >= (SELECT period_date FROM start_of_period) AND created_at < (SELECT period_date FROM start_of_period) + interval '1 month') AS new_customers,
        (SELECT COUNT(id) FROM customers WHERE created_at < (SELECT period_date FROM start_of_period) + interval '1 month') AS ending_customers
)
SELECT
    (ending_customers – new_customers) * 100.0 / starting_customers AS retention_rate
FROM
    period_metrics;
- Example: Run this query and change the
period_dateto get the retention rate for any month. It’s clean, repeatable, and ready for your dashboard.
Build a monthly cohort analysis with SQL
This next query groups users by sign-up month and tracks their activity over time.
This gives you the raw data for the cohort tables investors love. According to Forbes, attracting a new customer can cost five times more than retaining an existing one, making this analysis critical. You can find more customer retention statistics to back up its importance.
WITH user_monthly_activity AS (
    SELECT
        user_id,
        DATE_TRUNC('month', activity_date)::date AS activity_month
    FROM
        user_activity
    GROUP BY 1, 2
),
cohorts AS (
    SELECT
        user_id,
        MIN(activity_month) AS cohort_month
    FROM
        user_monthly_activity
    GROUP BY 1
)
SELECT
    c.cohort_month,
    DATE_PART('year', a.activity_month) * 12 + DATE_PART('month', a.activity_month) –     (DATE_PART('year', c.cohort_month) * 12 + DATE_PART('month', c.cohort_month)) AS month_number,
    COUNT(DISTINCT a.user_id) AS retained_users
FROM
    user_monthly_activity a
JOIN
    cohorts c ON a.user_id = c.user_id
GROUP BY 1, 2
ORDER BY 1, 2;
- Example: The output of this query gives you three columns:
cohort_month,month_number, andretained_users. Pivot this data in a spreadsheet to create a visual cohort chart that shows retention trends over time.
Common retention mistakes that kill credibility
Calculating retention seems easy. But small errors can tank your credibility with investors.
Getting the math wrong signals a lack of rigor. It makes VCs wonder what else you’re missing.
Use this section as your pre-flight checklist to ensure your numbers are accurate and defensible.
Mixing new and reactivated customers
This is the most common mistake. When a churned customer returns, don’t count them as "new."
Including them in your new customers count inflates your acquisition and retention rates. It’s a vanity metric that masks churn.
An investor who spots this will question everything else you present.
- Example: You start with 1,000 customers. You get 100 new customers and 20 old ones return. You end with 1,050.
- Wrong:
((1050 – 120) / 1000) * 100 = 93%. This hides the real retention. - Right:
((1050 – 100) / 1000) * 100 = 95%. This accurately shows retention of your starting base.
- Wrong:
Ignoring customer segmentation
Not all customers are equal. A single, blended rate can hide dangerous trends.
Failing to segment is like acing easy test questions and bombing the hard ones. You might be killing it with SMBs while enterprise clients churn.
You must segment your retention analysis.
Customer tier: Enterprise, mid-market, SMB.
Acquisition channel: Organic, paid, referral.
Pricing plan: Basic, pro, premium.
Example: A B2B SaaS reports a healthy 94% monthly retention. But a closer look reveals their $50/month plan has 98% retention, while their crucial $1,000/month enterprise plan has 85%. The blended rate masked a fire in their most valuable segment.
Using inconsistent time periods
Consistency is king. Comparing a 30-day month to a 31-day month is sloppy.
Mixing monthly, quarterly, and annual calculations without reason makes trend analysis impossible. It suggests a lack of discipline.
Pick a standard period – usually monthly for SaaS – and stick to it.
- Example: A founder shows 95% retention in Q1, 96% in April, and 94% in May. An investor will immediately ask why they’re mixing views. It looks amateurish and suggests you might be cherry-picking data.
Your retention calculation checklist
| Check point | Why it matters | Action to take |
|---|---|---|
| Separate new vs. reactivated | Mixing them inflates metrics and masks real churn. | Create a category for "reactivated." Do not include them in your "new customers" count. |
| Segment your customers | A single rate hides crucial trends in valuable groups. | Analyze retention by pricing tier, channel, and customer size. |
| Use consistent time periods | Inconsistent periods make trend analysis impossible. | Choose a standard reporting period (e.g., monthly) and stick to it. |
| Define "active customer" clearly | A vague definition allows for manipulation. | Document a precise definition (e.g., "user logged in and performed a core action in the last 30 days"). |
| Account for downgrades | A customer moving to a free plan is a form of churn. | Decide if your primary metric is logo retention or revenue retention. Be prepared to show both. |
Getting these details right builds trust. Clean, consistent numbers show you have a deep, professional understanding of your business.
How to present retention to investors
You have clean, accurate numbers. But raw data doesn’t raise capital. A killer story does.
Investors need to know what your numbers mean for the future. Your job is to translate a spreadsheet into a powerful narrative.
Show them how your sticky product translates into long-term value.
Visualize your cohorts for clarity
The most effective way to present retention is with a cohort chart.
It’s the one visual VCs expect. It tells a story of momentum at a glance.
A strong cohort chart shows two things:
A "smile" or flatten out: The curve for each cohort should level off, not drop to zero. This proves you have a core group of dedicated users.
Cohort-over-cohort improvement: Newer cohorts should retain better than older ones. This proves your product is getting better.
Example: Instead of just showing the chart, use a powerful title: "Our product is getting stickier. Newer cohorts retain 15% better." This gives the investor the takeaway before they even read the numbers.
Connect retention directly to LTV
Your retention rate isn’t a standalone metric. It’s the engine that drives your LTV.
A high retention rate is interesting. A high retention rate that doubles your LTV is compelling.
Show them the math. A simple table is incredibly effective. Link these two metrics side-by-side to turn an abstract percentage into a tangible dollar figure. Our guide on how to create a pitch deck covers framing financial metrics in detail.
- Example: A slide shows that a 5% increase in month-over-month retention leads to a 30% increase in LTV. This proves your business model is profitable and scalable.
Frame the narrative with strong vs. weak slides
How you frame your data is as important as the data itself.
The weak slide: A busy, unlabeled chart with no clear takeaway. The investor is left to interpret the data.
- Title: "Monthly retention"
- Visual: A standard cohort table with no highlights.
- Takeaway: None. It’s a data dump.
The strong slide: Tells a clear, confident story.
- Title: "Product improvements drove month 1 retention from 85% to 92%"
- Visual: A heat-mapped cohort chart with an arrow pointing to the improvement.
- Takeaway: "Our new onboarding flow, launched in Q2, is responsible for this uplift."
The strong slide proves you aren’t just watching numbers – you’re actively influencing them.
Ready to turn your data into a compelling fundraising narrative? Pitchili combines VC-side insight with world-class design to build pitch decks with metrics that command attention.
Get your investor-ready pitch deck.
FAQ
What is a good customer retention rate for a SaaS startup?
There’s no magic number. It depends on your industry, customer type, and price point. However, investors look for specific signals:
– Net revenue retention over 100%. This means existing customers are spending more over time, a clear sign of a healthy, scaling business.
– A "smiling" cohort curve. This happens when your retention rate flattens or even ticks up, proving true product-market fit.
Showing improvement cohort-over-cohort is more powerful than hitting an arbitrary number.
How do I handle customers who cancel and then come back?
They are "reactivated," not "new." This is critical for credibility.
– Do not include them in 'N' (new customers) in the formula.
– Add them back to your total customer count 'E' (ending customers).
– Slot them back into their original cohort for analysis.
This gives you an honest picture of your churn and resurrection rates
Should I measure customer retention or revenue retention?
Measure both. They tell two different but critical parts of the story.
– Customer retention (logo retention) answers: "Is our product sticky?"
– Revenue retention answers: "Are we making more money from the customers we had last month?"
Presenting both shows you have a deep, nuanced grasp of your startup’s financial engine.
