
Financial projections are not about predicting the future. They are about telling a believable story with numbers. Your goal is to show investors you have a credible plan to build a big business.
This guide gives you a step-by-step framework to create financial projections that win investor trust and get you funded.
Why most financial models fail (and how yours won’t)
Investors see hundreds of financial models. Most are ignored. Why? They are built on fantasy, not facts. A wild hockey-stick graph without a credible story is a red flag. It shows a founder hasn’t done their homework.
Your projections are a test of your strategic thinking. Make them count.
The biggest mistake is a bottom-up forecast that ignores market reality.
- A bottom-up forecast builds revenue from your direct actions. Example: Website traffic converts at 2%.
- A top-down forecast looks at the total market (TAM) and the slice you can capture.
Your model must connect these two views. If your bottom-up math shows you capturing 30% of the market in year two, investors will know you are disconnected from reality. Your credibility will be gone.
Before you open a spreadsheet, adopt an investor’s mindset. They don’t expect perfection. They expect proof you understand your business.
They want to see that you’ve thought critically about:
- Key drivers: What 2-3 metrics actually move the needle?
- Assumptions: Are your assumptions backed by data or early traction?
- Scalability: Do your unit economics improve as you grow?
A great financial model tells a story. It starts with clear assumptions and shows a logical path to growth. This guide is a playbook for building projections that stand up to VC scrutiny.
The anatomy of a credible financial projection
Here is a simple breakdown of what investors look for in your model. Think of these as the chapters in your financial story.
| Component | What it is | Why investors care |
|---|---|---|
| Assumptions sheet | Lists all key inputs like conversion rates, pricing, and churn. | This is the first place they look. It shows if your logic is grounded in reality. |
| Revenue buildup | A step-by-step calculation from core drivers to final revenue. | It proves your revenue is the result of a clear, actionable plan. |
| Operating model | Your budget for COGS, Sales & Marketing, R&D, and G&A. | It shows you understand what it costs to run and scale the business. |
| 3 financial statements | The income statement, balance sheet, and cash flow statement. | This is the language of business. A linked 3-statement model shows financial discipline. |
| KPIs & unit economics | Metrics like LTV, CAC, and payback period that prove sustainability. | These numbers reveal the health of your business at the customer level. |
1. Start with realistic assumptions
Your entire financial model is a house. Your assumptions are its foundation. If the foundation is shaky, the whole structure collapses when an investor pokes it.
This is where you prove you are a strategic founder, not just a dreamer.
Separate operational and financial drivers
Split your assumptions into two buckets: operational and financial. This shows you understand which levers move your business.
Operational assumptions are inputs you control. They are the "how" behind your growth story.
- Team growth: How many engineers will you hire each quarter?
- Marketing spend: What is your monthly ad budget?
- Sales efficiency: How many demos can one rep run per month?
Financial assumptions are the direct results of those choices. They translate your actions into dollars.
- Conversion rates: What percentage of trial users become customers?
- Revenue per user: What is the average monthly recurring revenue (MRR)?
- Cost of goods sold (COGS): What are the direct costs to deliver your product?
Separating these creates a clear story. An investor can see that hiring three salespeople (operational) directly impacts your payroll and should lead to more MRR (financial).
Ground your numbers in reality
An assumption without a source is just a guess. Tie your key metrics to real-world data.
Investors have seen thousands of pitches. They can spot unrealistic benchmarks.
Do your homework. Dig into industry reports and competitor filings.
A classic mistake is projecting margins way above the industry average without a great explanation. If a typical SaaS company has an 80% gross margin, and your model shows 95%, you need an airtight reason.
For early-stage startups, the numbers that get scrutinized most are tied to what is unit economics. You must prove you can acquire customers profitably. This is non-negotiable.
Create a dedicated assumptions tab
This is the most practical thing you can do. Put all your assumptions on one "assumptions" tab in your spreadsheet. This tab is the control panel for your entire model. It is the first place a savvy investor will look.
Do not bury your logic in complex formulas. Lay everything out cleanly in one place. This transparency builds trust because it shows you aren’t hiding anything.
Example: a simple assumptions tab for a SaaS startup
| Category | Driver | Year 1 | Year 2 | Year 3 | Source / justification |
|---|---|---|---|---|---|
| Marketing | monthly ad spend | $5,000 | $15,000 | $30,000 | scales with funding |
| cost per click (cpc) | $4.50 | $5.00 | $5.50 | industry benchmark data | |
| website conversion rate | 2.0% | 2.5% | 3.0% | based on early a/b test results | |
| Sales | sales rep quota (annual) | $600,000 | $750,000 | $750,000 | aligned with industry standards |
| average contract value (acv) | $12,000 | $15,000 | $18,000 | price increases and upselling | |
| Customer success | annual churn rate | 15% | 12% | 10% | improves with product maturity |
This structure lets an investor play with the numbers. They can change your conversion rate and see how it impacts the entire model. That is the mark of a professional forecast.
2. Build your revenue and cost models
You have your assumptions. Now it’s time to build the engine of your financial model. This is where you translate your strategy into a clear, bottom-up forecast.
The goal is a logical, driver-based model, not numbers pulled from thin air.
Build your revenue forecast step-by-step
A credible revenue forecast is always built from the ground up. You start with activities you control and follow them to the financial outcome. This proves you understand the mechanics of your business.
For a SaaS company, the logic might look like this:
- Top of funnel: Start with website visitors, driven by your marketing budget.
- Leads: Apply your visitor-to-trial conversion rate to get new leads.
- Customers: Apply your trial-to-paid conversion rate to get new paying customers.
- Revenue: Multiply new customers by your average revenue per account (ARPA).
This method links your spending directly to your revenue. We break this down further in our guide on how to build a revenue forecast. The key is to use a simple formula: Driver x Conversion Rate x Price = Revenue. This structure makes it easy for anyone to follow your logic.
Define your cost structure
Once you model revenue, project your costs. Investors will scrutinize your costs to understand your capital efficiency and path to profitability.
Split your expenses into two main categories: cost of goods sold (COGS) and operating expenses (Opex).
Cost of goods sold (COGS) includes all direct costs to deliver your product. These are variable costs that grow with revenue. If you stop selling, these costs should drop to zero.
- For e-commerce: The cost of physical products, transaction fees, and shipping.
- For SaaS: Server hosting fees (AWS), third-party data providers, and customer support salaries.
Calculating your gross margin (Revenue – COGS) is critical. A high and improving gross margin shows your business is scalable.
Operating expenses (Opex) covers the fixed costs to run your business. These are investments you make to grow.
- Sales & Marketing (S&M): Ad budgets, sales team salaries, and marketing software.
- Research & Development (R&D): Salaries for engineers, designers, and product managers.
- General & Administrative (G&A): Executive salaries, rent, and legal fees.
Properly categorizing these costs shows you are prepared to manage your budget as you scale.
Use historical data as a baseline
If you have past performance data, use it. It is the most credible starting point for your projections.
A manufacturer with consistent growth can project future sales by applying its historical growth rate. If revenue grew by an average of 12.5% over the past four years to reach $16.0 million, a simple projection for next year would be $18.0 million. This method must be adjusted for factors like market downturns or seasonality.
For a deeper dive into forecasting methods, you can find valuable examples on FE Training.
3. Connect the three financial statements
You built your operational model. Now translate it into the language investors speak: the three core financial statements.
They must work together to paint a complete picture of your company’s financial health. An investor will check how these statements connect to gauge your financial literacy. If the cash on your balance sheet doesn’t match your cash flow statement, your credibility is gone.
This simple map shows how your drivers flow through your model.
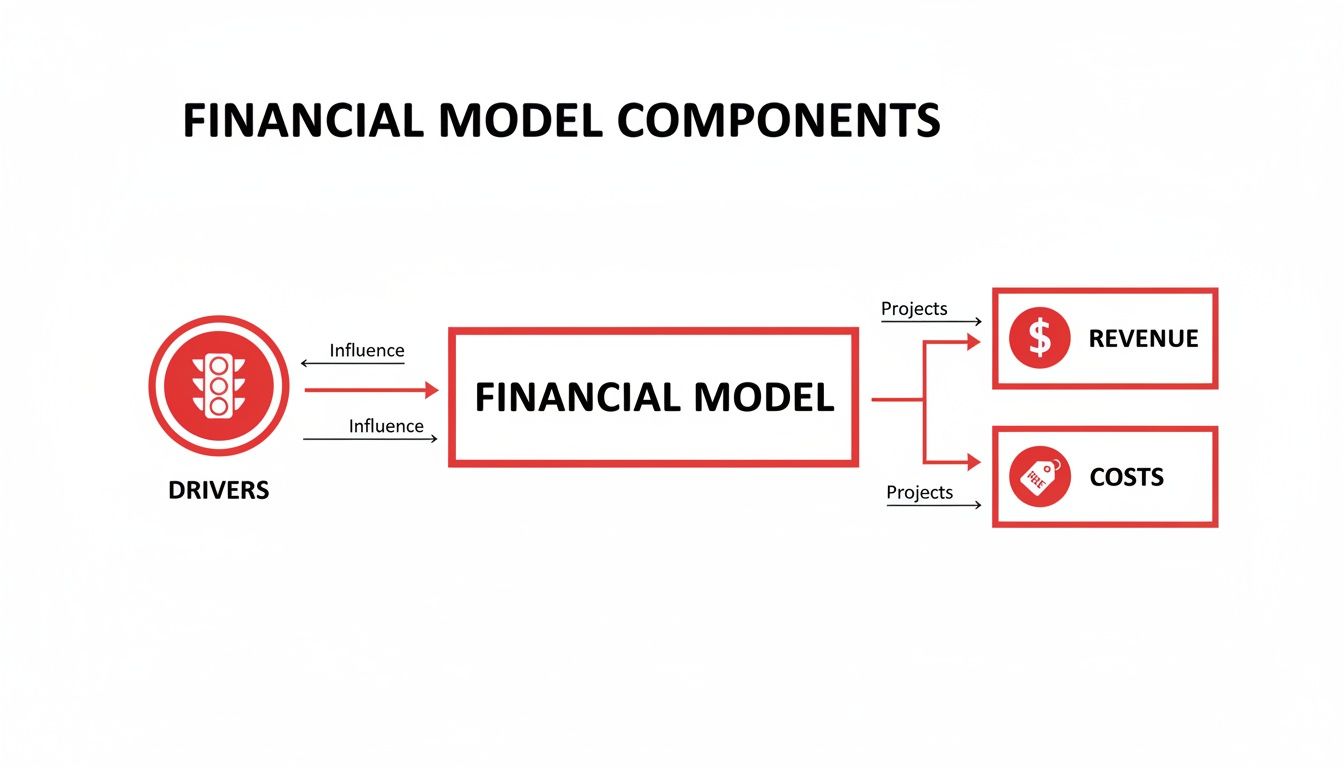
Your projections are the direct output of your business assumptions.
The income statement: your path to profitability
The income statement, or Profit & Loss (P&L), shows your financial performance over a period. The structure is simple: Revenue – Expenses = Net Income (or Loss).
You have already built your revenue and cost models. Now, slot them into the P&L structure.
- Total Revenue: $25,000
- COGS: -$5,000
- Gross Profit: $20,000 (an 80% gross margin)
- Operating Expenses: -$30,000
- Net Loss: -$10,000
This tells a clear story. In this case, the company is not yet profitable, which is normal for an early-stage startup focused on growth.
The balance sheet: a snapshot in time
The balance sheet is a snapshot of your company’s financial position at a single point in time. It follows one equation: Assets = Liabilities + Equity. It shows what you own, what you owe, and what’s left.
For an early-stage startup, keep it simple.
- Assets: Your main asset will be cash.
- Liabilities: Any debt you have, like a startup loan.
- Equity: The owners' stake, plus accumulated profits or losses (retained earnings).
Your net income from the P&L flows directly into the equity section of the balance sheet. This is a key connection that keeps the statements in sync.
The cash flow statement: the ultimate source of truth
For a startup, cash is king. The statement of cash flows is the most critical document for investors. A profitable company on paper can still go bankrupt if it runs out of cash.
This statement breaks down cash movements into three buckets:
- Cash from operations: Cash your core business generates or burns.
- Cash from investing: Cash used for buying assets like equipment.
- Cash from financing: Cash from investors or used to repay debt.
The bottom line of the cash flow statement is your net change in cash. When you add this to your beginning cash balance, the result must match the ending cash balance on your balance sheet. This is the ultimate test of a well-built model. It directly calculates your calculate your burn rate and runway.
4. Stress-test your model with scenario analysis
A single forecast is a single point of failure. Your base-case projection is almost guaranteed to be wrong. Investors know this. They fund founders who are prepared for it.
Stress-testing your model with scenario analysis proves you are prepared. It shows you’ve considered what could go right, what could go wrong, and how you will react.
Create three core scenarios
Every investor expects to see three versions of your financial story: a realistic base case, an ambitious best case, and a conservative worst case.
- Base case: Your most likely, realistic forecast. This is the plan you are executing against.
- Best case (upside): Your optimistic scenario. What if a marketing channel wildly outperforms? This shows the potential scale of the opportunity.
- Worst case (downside): Your contingency plan. What if your CAC is 30% higher than projected? This is the most important for assessing risk.
Your worst-case scenario directly impacts your fundraising ask. It tells an investor how much cushion you need to survive unexpected turbulence.
Identify your most sensitive drivers
Focus on the two or three assumptions that have the biggest impact on your bottom line. This is sensitivity analysis. For most startups, these are:
- Customer conversion rate
- Customer acquisition cost (CAC)
- Churn rate
By isolating these drivers, you can see where your business is most vulnerable and where the biggest opportunities lie. Build your scenarios around realistic shifts in these metrics.
Your worst-case scenario is not a sign of weakness. It is a mark of a mature founder. It proves you have thought about survival, not just success.
Present your scenarios clearly
The final step is to present your analysis in a clean, scannable format. A simple summary table is the perfect way to do this.
This table should connect your scenarios to key drivers and, most importantly, to your cash runway. It instantly answers the critical investor question: "How will this business perform under pressure?"
Example: scenario analysis summary
| Metric | Worst case | Base case | Best case |
|---|---|---|---|
| Key driver assumption | CAC is 30% higher | As planned | Conversion rate is 25% higher |
| Year 1 revenue | $450,000 | $600,000 | $800,000 |
| Year 1 net burn | -$750,000 | -$500,000 | -$250,000 |
| Cash runway (with funding) | 14 months | 20 months | 30 months |
This simple table does a huge amount of work. It shows you’ve done the analysis, you understand your key risks, and you have a clear-eyed view of your capital needs. That’s how you build confidence.
Crafting financial projections requires strategic thinking, analysis, and clear storytelling. At Pitchili, we partner with founders to build credible, investor-ready financial models that anchor a compelling fundraising narrative.
Explore how we can help you build projections that win term sheets
FAQ
How far out should my financial projections go?
A 3-year forecast is the gold standard for an early-stage startup. Anything beyond that is guesswork, and investors know it. They expect a highly detailed plan for the first 12-18 months. This is your post-funding operating plan. Go monthly for the first year. Then switch to quarterly for years two and three.
Should i use a template or build my own model?
The best answer is a hybrid approach. Start with a high-quality financial projections template. It gives you a proven structure and helps you avoid common mistakes. But you must customize it. An unmodified template is an immediate red flag. It shows you haven’t done the deep thinking required to understand your own business. Rebuild the revenue, cost, and assumptions tabs to make the model authentically yours.
How do i project revenue with no historical data?
This is the classic pre-revenue challenge. You must build a credible, driver-based forecast from the bottom up. Start with the activities you can control at the top of your funnel.
1. Forecast traffic based on your planned marketing spend. ("We’ll spend $5k/mo on ads to drive 10,000 visits").
2. Apply a conservative conversion rate to estimate sign-ups. ("A 2% conversion rate gives us 200 new users").
3. Use your pricing model to calculate revenue. ("If 5% convert to our $20/mo plan, that’s $200 in new MRR").
Finally, sanity-check your bottom-up numbers with a top-down market analysis. If your projections show you grabbing an unrealistic slice of the market too quickly, your assumptions are too aggressive.
